Fig. 3.
Download original image
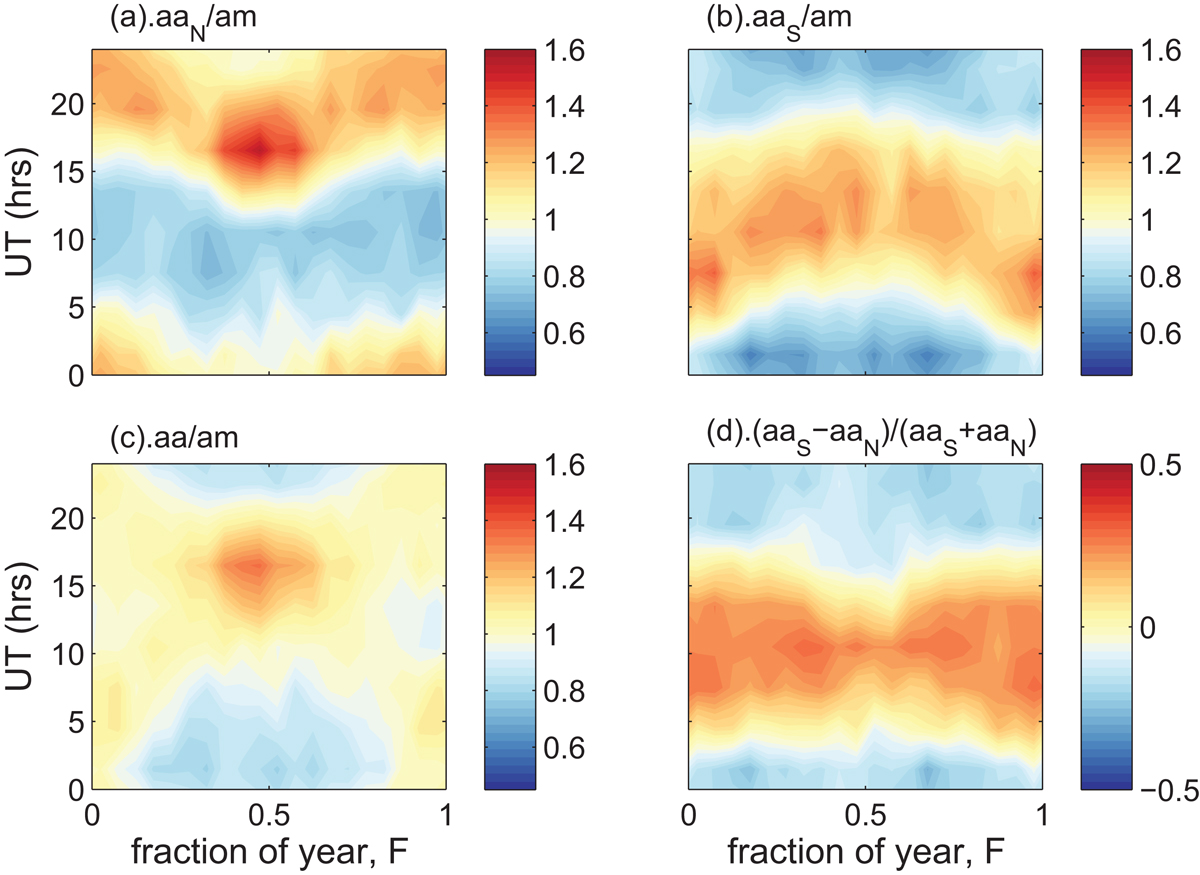
Time-of-year (F), time-of-day (UT) plots of observed ratios of geomagnetic indices. All indices are 3-hourly so there are 8 UT bins and the 3-hourly ratios have been averaged into 20 equal-sized bins in F. (a) ![]() ; (b)
; (b) ![]() ; (c) aa′/am; and (d) the aa′ hemispheric anisotropy ratio
; (c) aa′/am; and (d) the aa′ hemispheric anisotropy ratio ![]() . This plot is for all data in 1959–2017 with 70 ≤ aa′ < 110 nT, for which the mean aa′ is 88.15 nT.
. This plot is for all data in 1959–2017 with 70 ≤ aa′ < 110 nT, for which the mean aa′ is 88.15 nT.
Current usage metrics show cumulative count of Article Views (full-text article views including HTML views, PDF and ePub downloads, according to the available data) and Abstracts Views on Vision4Press platform.
Data correspond to usage on the plateform after 2015. The current usage metrics is available 48-96 hours after online publication and is updated daily on week days.
Initial download of the metrics may take a while.