Fig. 2

Download original image
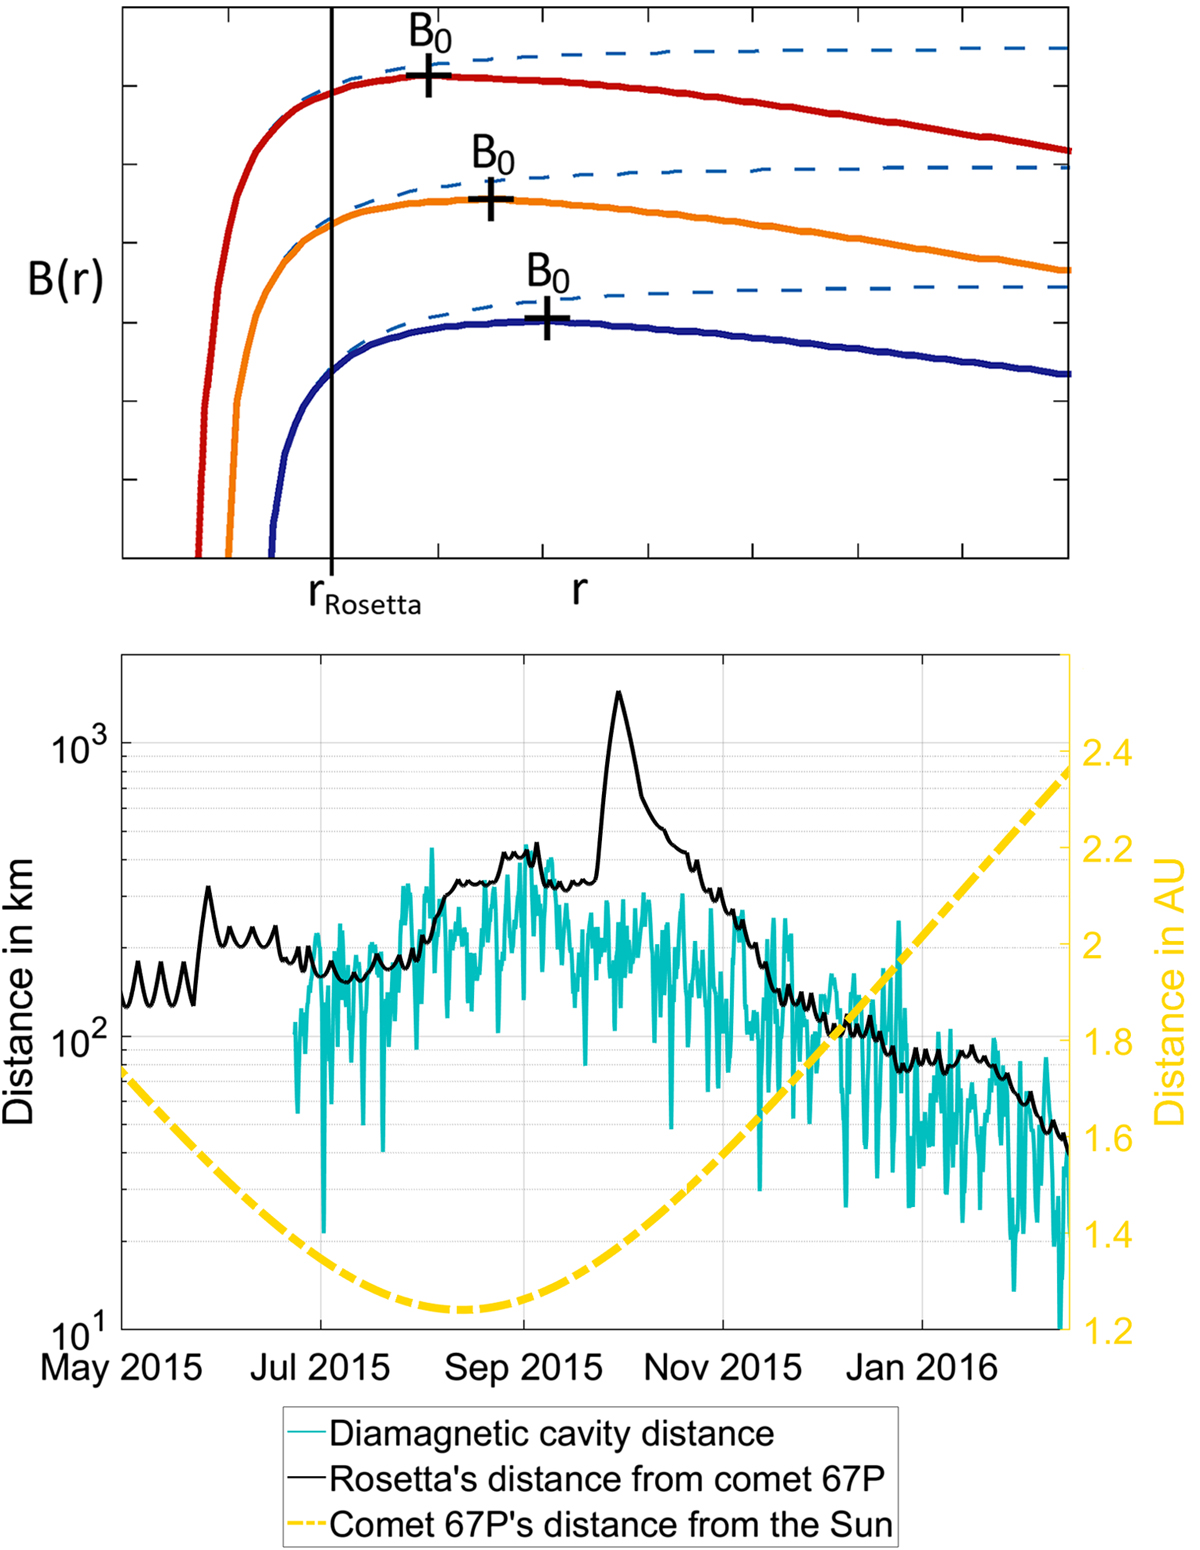
In the upper panel we illustrate the shape of the B(r) function according to Cravens (dashed blue lines) depending on the cometary distance in different solar wind conditions. The nucleus and the diamagnetic cavity is on the left, the solar wind arrives from the right-hand side. The vertical black line illustrates the distance of the Rosetta spacecraft (rRosetta) from comet 67P. Monotonically growing from zero to maximum, the Cravens solution reaches the B0 value at infinity. In practice, however, the magnetic field reaches its maximum in a finite distance from the diamagnetic cavity boundary then it starts to decrease. The coloured (red, orange, blue) lines illustrate this behaviour. The blue line represents a scenario with relatively low solar wind pressure; the B0 maximum (marked by black cross) is far away from both the comet and the location of the spacecraft. When the solar wind pressure increases, the B0 maximum is pushed back towards the comet while increasing in value (orange and red lines). The lower panel shows comet 67P’s distance from the sun (dashed yellow line), Rosetta’s distance from the comet (black line). The diamagnetic cavity’s extent calculated using OMNI mSWiM solar wind dynamic pressure is illustrated by the light blue line. The Cravens solution is close to these representations in the upper panel at small cometary distances (r ≈ 3rcs).
Current usage metrics show cumulative count of Article Views (full-text article views including HTML views, PDF and ePub downloads, according to the available data) and Abstracts Views on Vision4Press platform.
Data correspond to usage on the plateform after 2015. The current usage metrics is available 48-96 hours after online publication and is updated daily on week days.
Initial download of the metrics may take a while.


