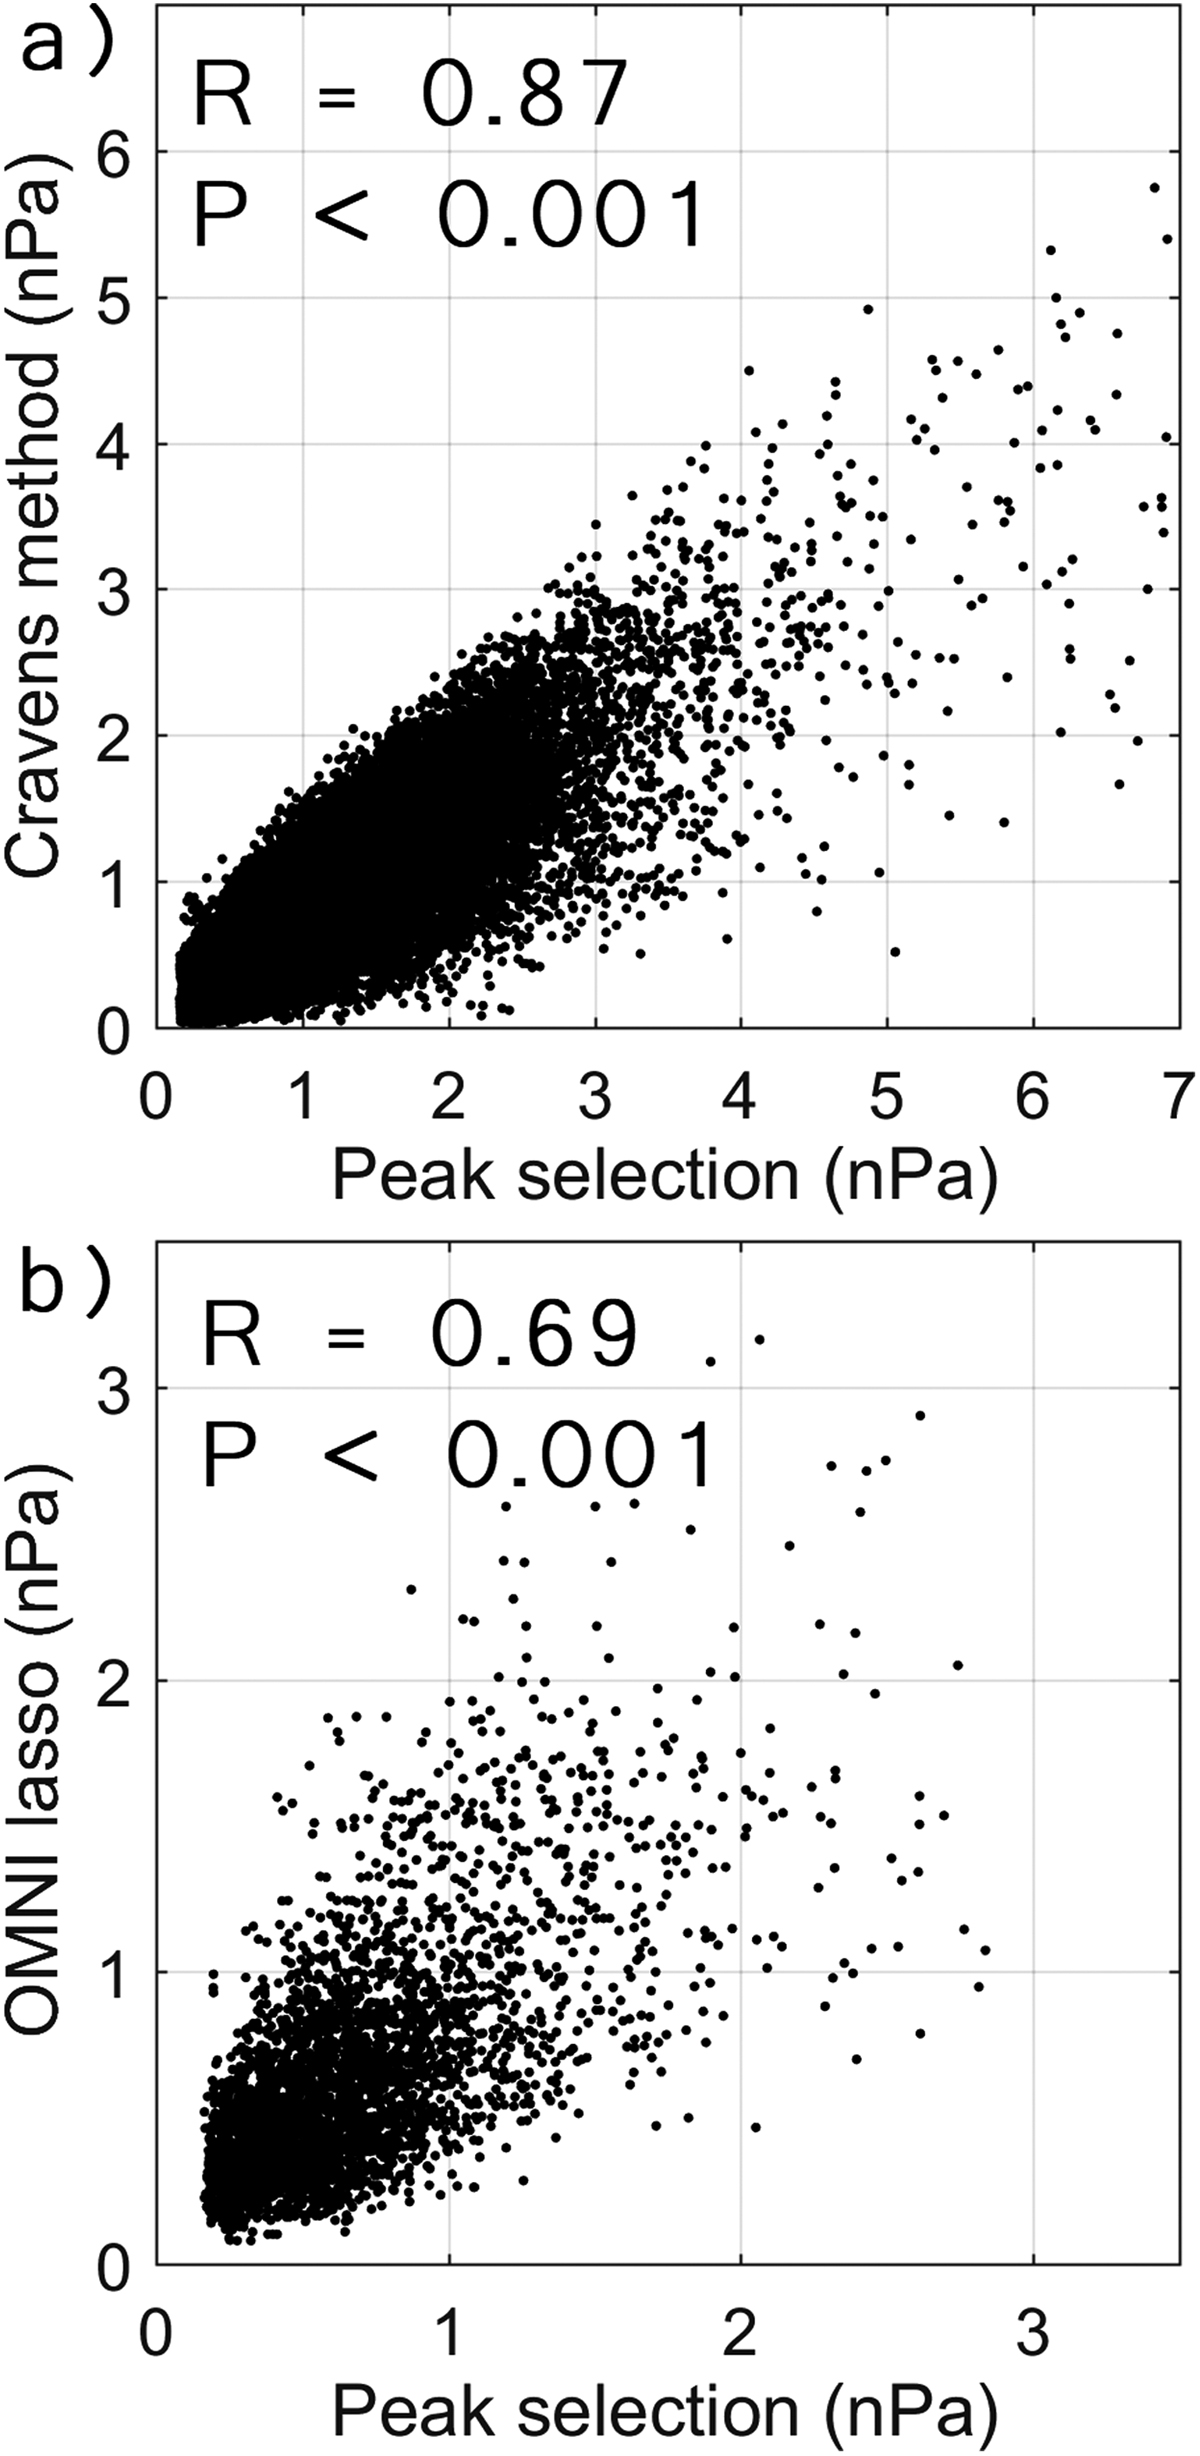
Fig. 7

Download original image
Comparing the peak-selection method and the Cravens solution (a) below dynamic pressure values of 7 nPa. The two methods correlate well with a correlation coefficient R = 0.87 and a p value less than 0.001. The plot shows that the Cravens solution tends to give lower estimates than the peak selection. In (b) we show the correlation between the peak-selection method and the OMNI lasso propagated solar wind dynamic pressure values. To calculate the correlation coefficient, we filtered out the transient events in the solar wind and got R = 0.69 and p < 0.001 showing a strong linear relationship between the two datasets.
Current usage metrics show cumulative count of Article Views (full-text article views including HTML views, PDF and ePub downloads, according to the available data) and Abstracts Views on Vision4Press platform.
Data correspond to usage on the plateform after 2015. The current usage metrics is available 48-96 hours after online publication and is updated daily on week days.
Initial download of the metrics may take a while.


