Open Access
Fig. 5
Download original image
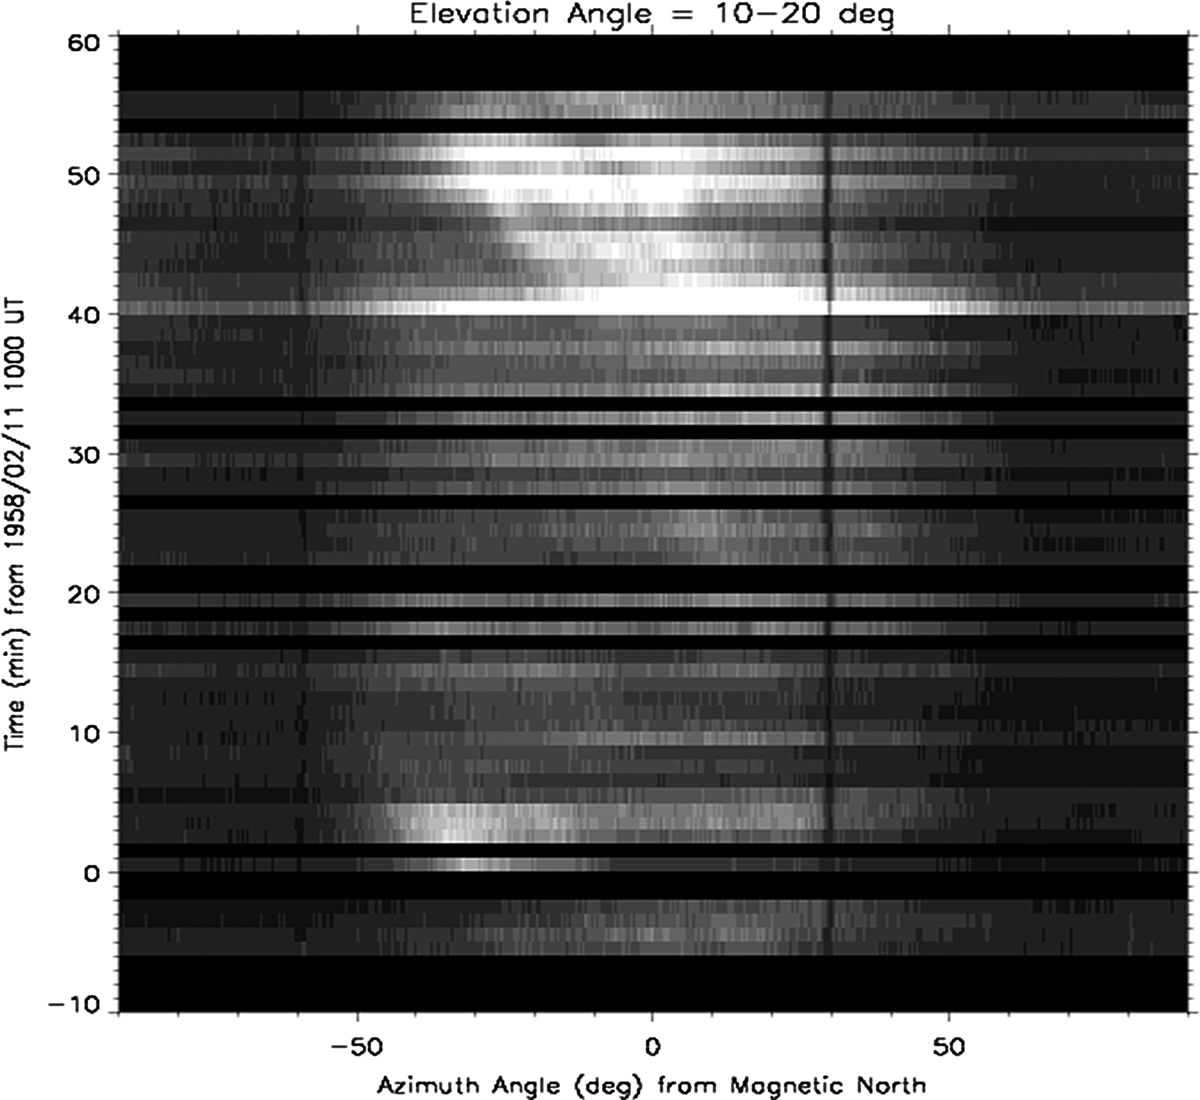
Time–position diagram of panchromatic auroral intensity at 0950–1100 UT at 10–20° elevation angle. Time is to the top, and the horizontal axis is the azimuth angle from the magnetic north.
Current usage metrics show cumulative count of Article Views (full-text article views including HTML views, PDF and ePub downloads, according to the available data) and Abstracts Views on Vision4Press platform.
Data correspond to usage on the plateform after 2015. The current usage metrics is available 48-96 hours after online publication and is updated daily on week days.
Initial download of the metrics may take a while.