Fig. 1

Download original image
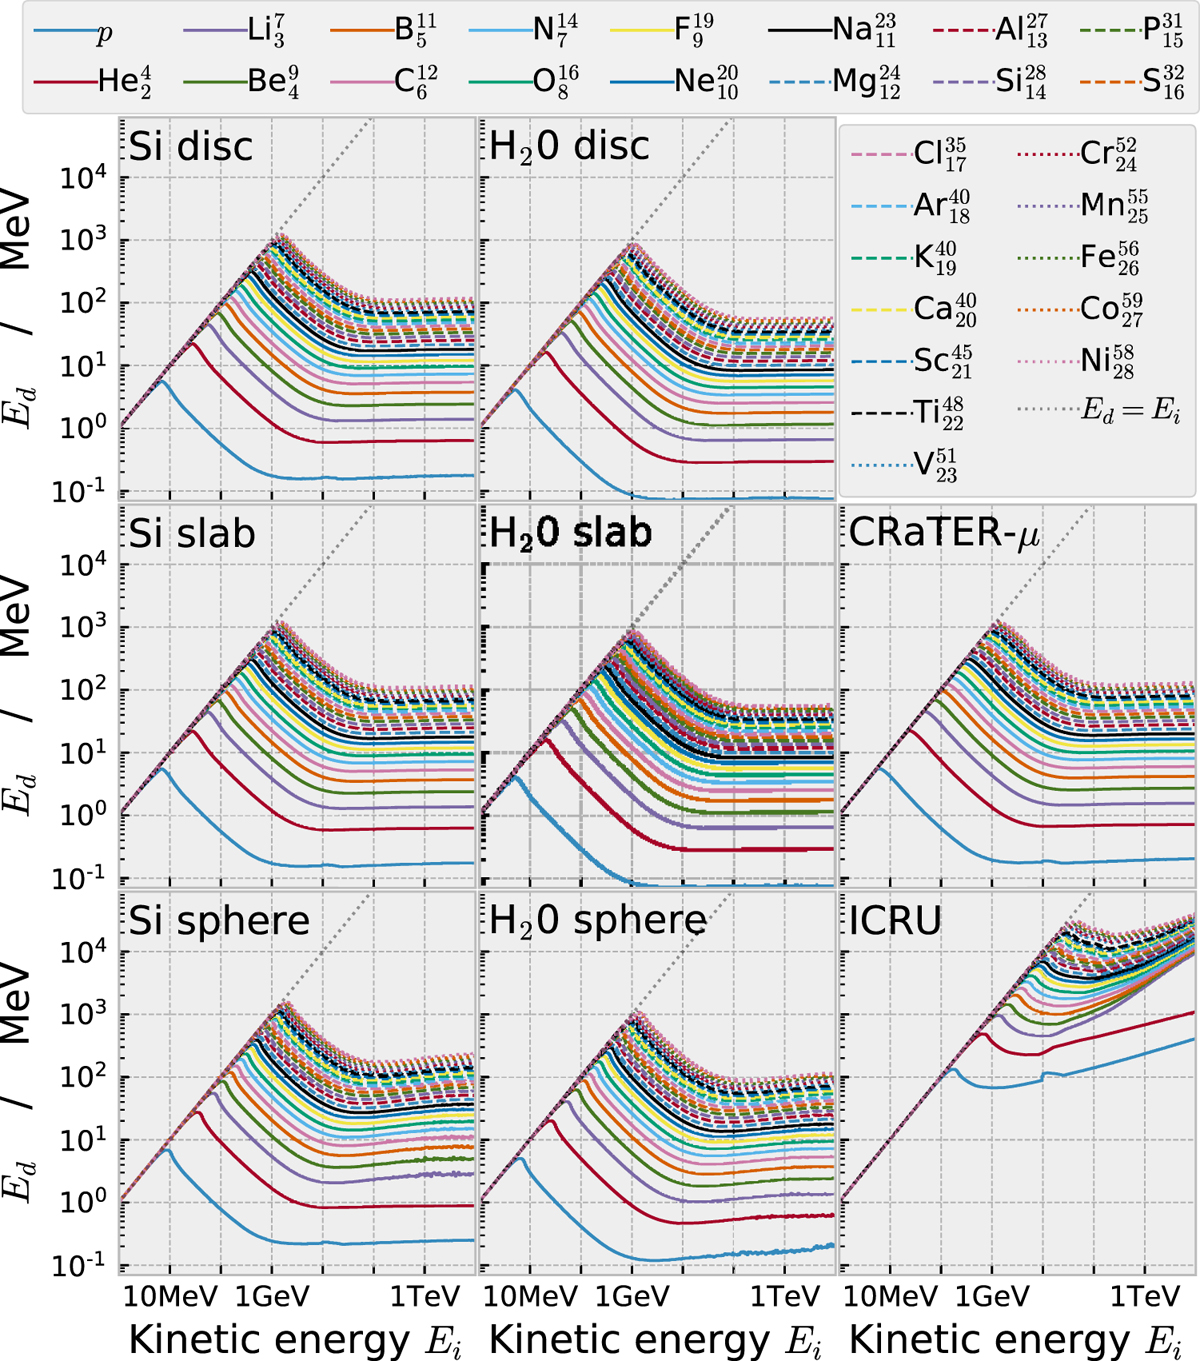
Detector response to charged particles: the deposited energy E D is shown as a function of kinetic energy E i . To each detector corresponds a single panel. For example the central panel is showing data for the H2O slab detector. The Si disc and Si slab detectors mimic typical semiconductor detectors used in space-related dosimetric experiments. The dotted line with slope 1 corresponds to full absorption. The different GCR nuclei are indicated with different colors and line styles, as shown in the legend.
Current usage metrics show cumulative count of Article Views (full-text article views including HTML views, PDF and ePub downloads, according to the available data) and Abstracts Views on Vision4Press platform.
Data correspond to usage on the plateform after 2015. The current usage metrics is available 48-96 hours after online publication and is updated daily on week days.
Initial download of the metrics may take a while.


