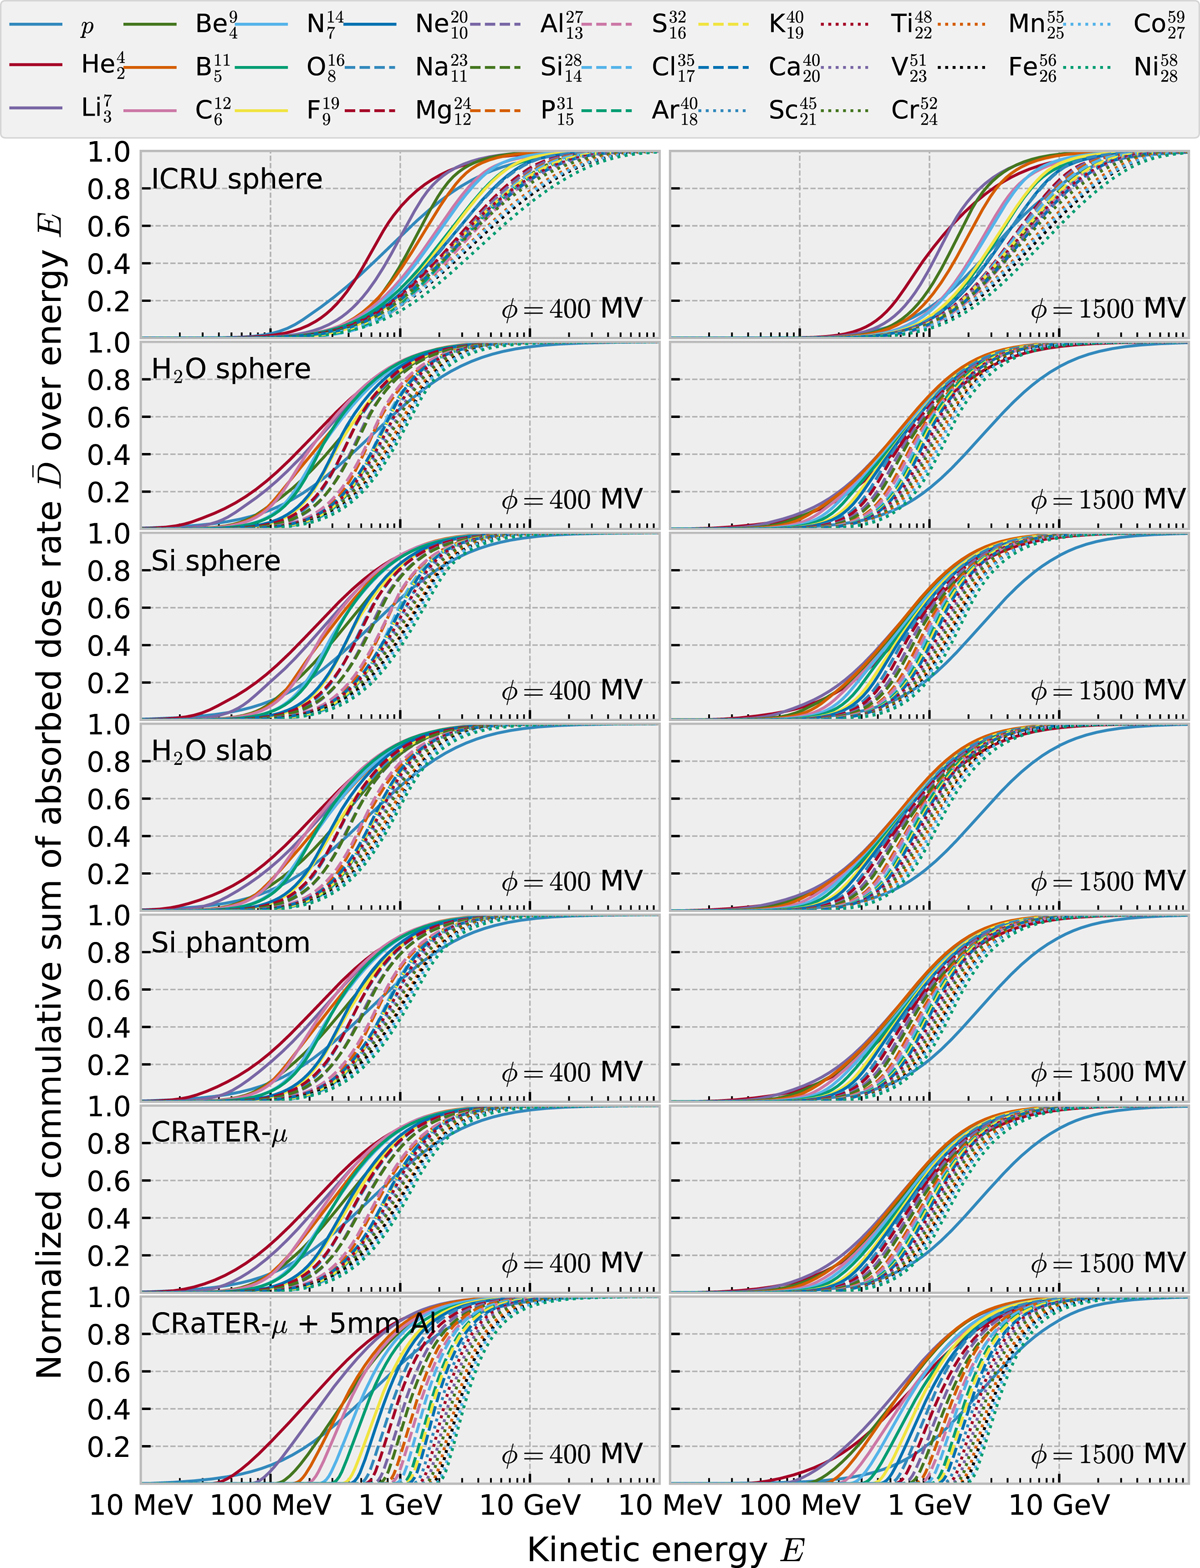
Fig. A2

Download original image
The normalized cumulative sum of absorbed dose over kinetic energy has been calculated for (i) the seven detectors and (ii) the two cases of solar activity, to each corresponding a separate figure panel (look at the upper corners). Each panel contains the 28 cumulative sums corresponding to the absorbed dose rates due to different GCR nuclei. We see that the energy range between 100 MeV and 100 GeV is where GCR are sufficiently abundant and/or are particularly effective at depositing significant ionization energy to the detectors.
Current usage metrics show cumulative count of Article Views (full-text article views including HTML views, PDF and ePub downloads, according to the available data) and Abstracts Views on Vision4Press platform.
Data correspond to usage on the plateform after 2015. The current usage metrics is available 48-96 hours after online publication and is updated daily on week days.
Initial download of the metrics may take a while.


