Fig. A3

Download original image
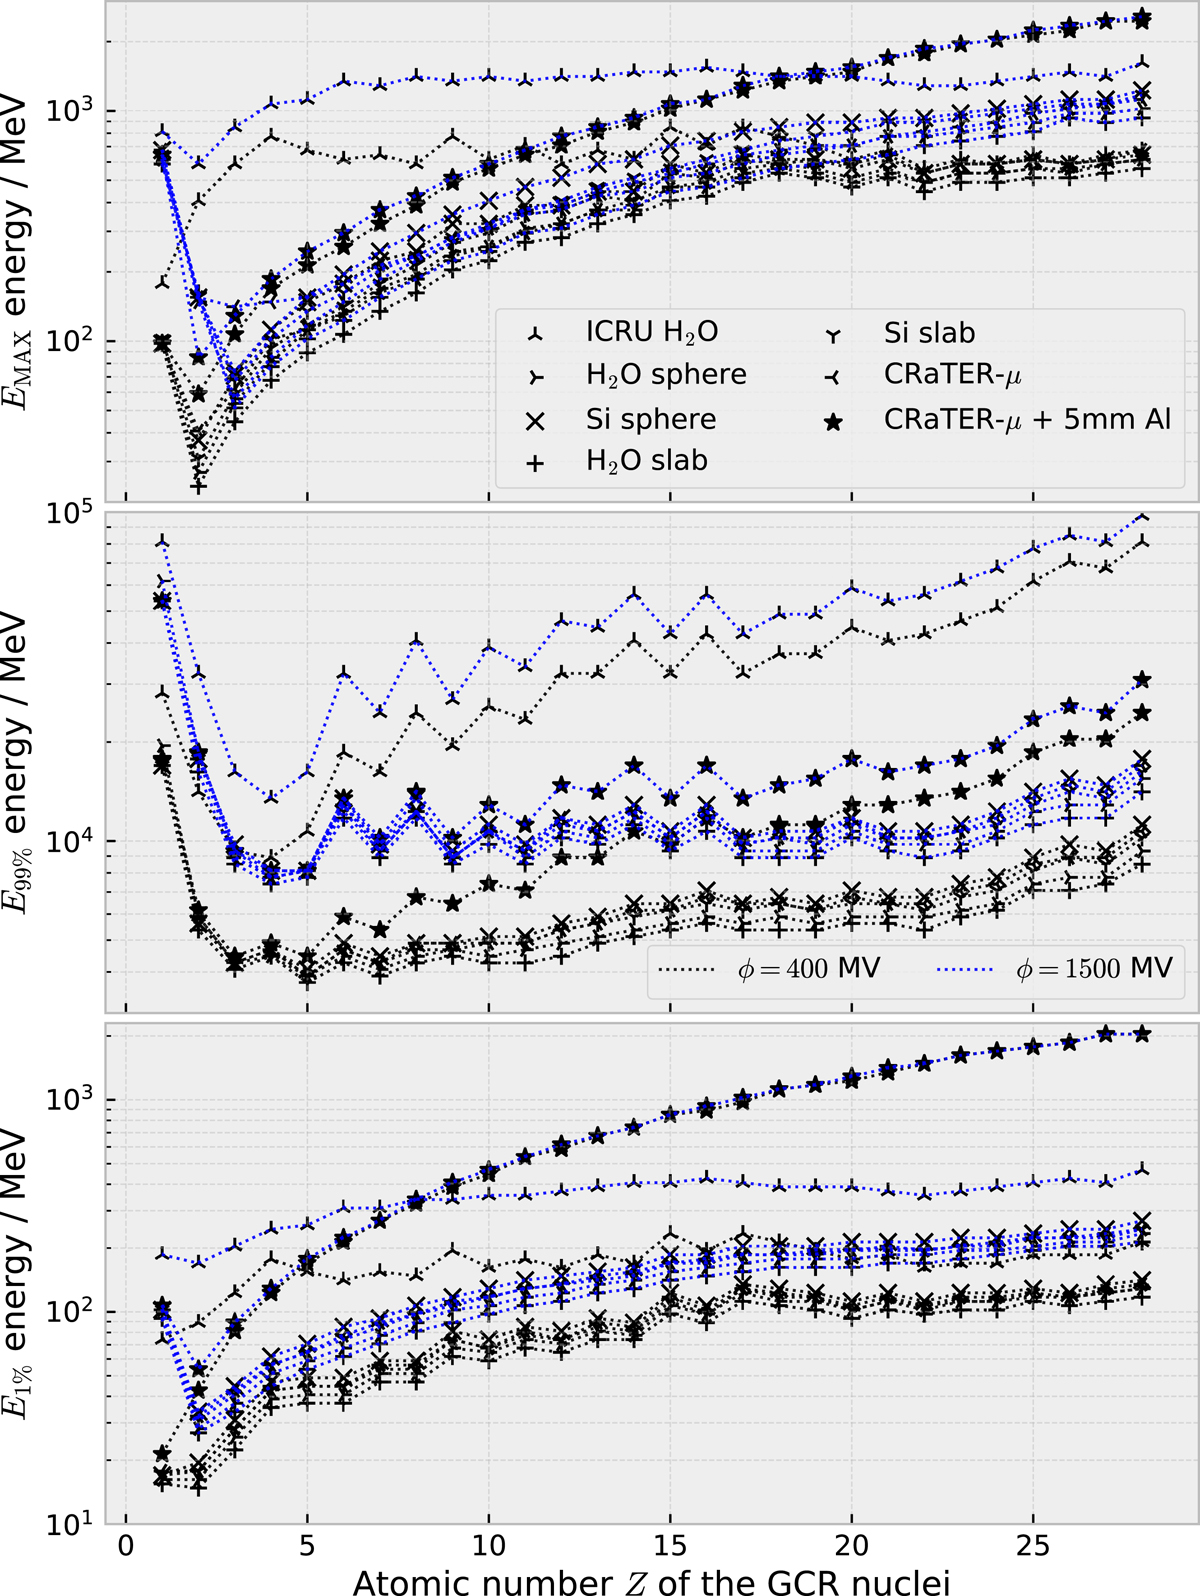
In order to characterize the significant energy range for each GCR nucleus, we have calculated the most harmful kinetic energy (top panel), the kinetic energy required to achieve 99% of the net absorbed dose rate (middle panel) and the kinetic energy required to achieve 1%. Each panel contains 14 scatter graphs corresponding to the seven phantoms indicated with different symbols and two levels of solar activity, indicated with two colors. For example, crosses with blue lines are for the H2O slab at solar maximum (ϕ = 1500 MV). Limiting our simulation to the energy range [E 1%, E 99%] would result in a underestimation ofthe absorbed dose rate of the order of 2%. Important data presented here has been summarized in Table A1.
Current usage metrics show cumulative count of Article Views (full-text article views including HTML views, PDF and ePub downloads, according to the available data) and Abstracts Views on Vision4Press platform.
Data correspond to usage on the plateform after 2015. The current usage metrics is available 48-96 hours after online publication and is updated daily on week days.
Initial download of the metrics may take a while.


