Fig. 10

Download original image
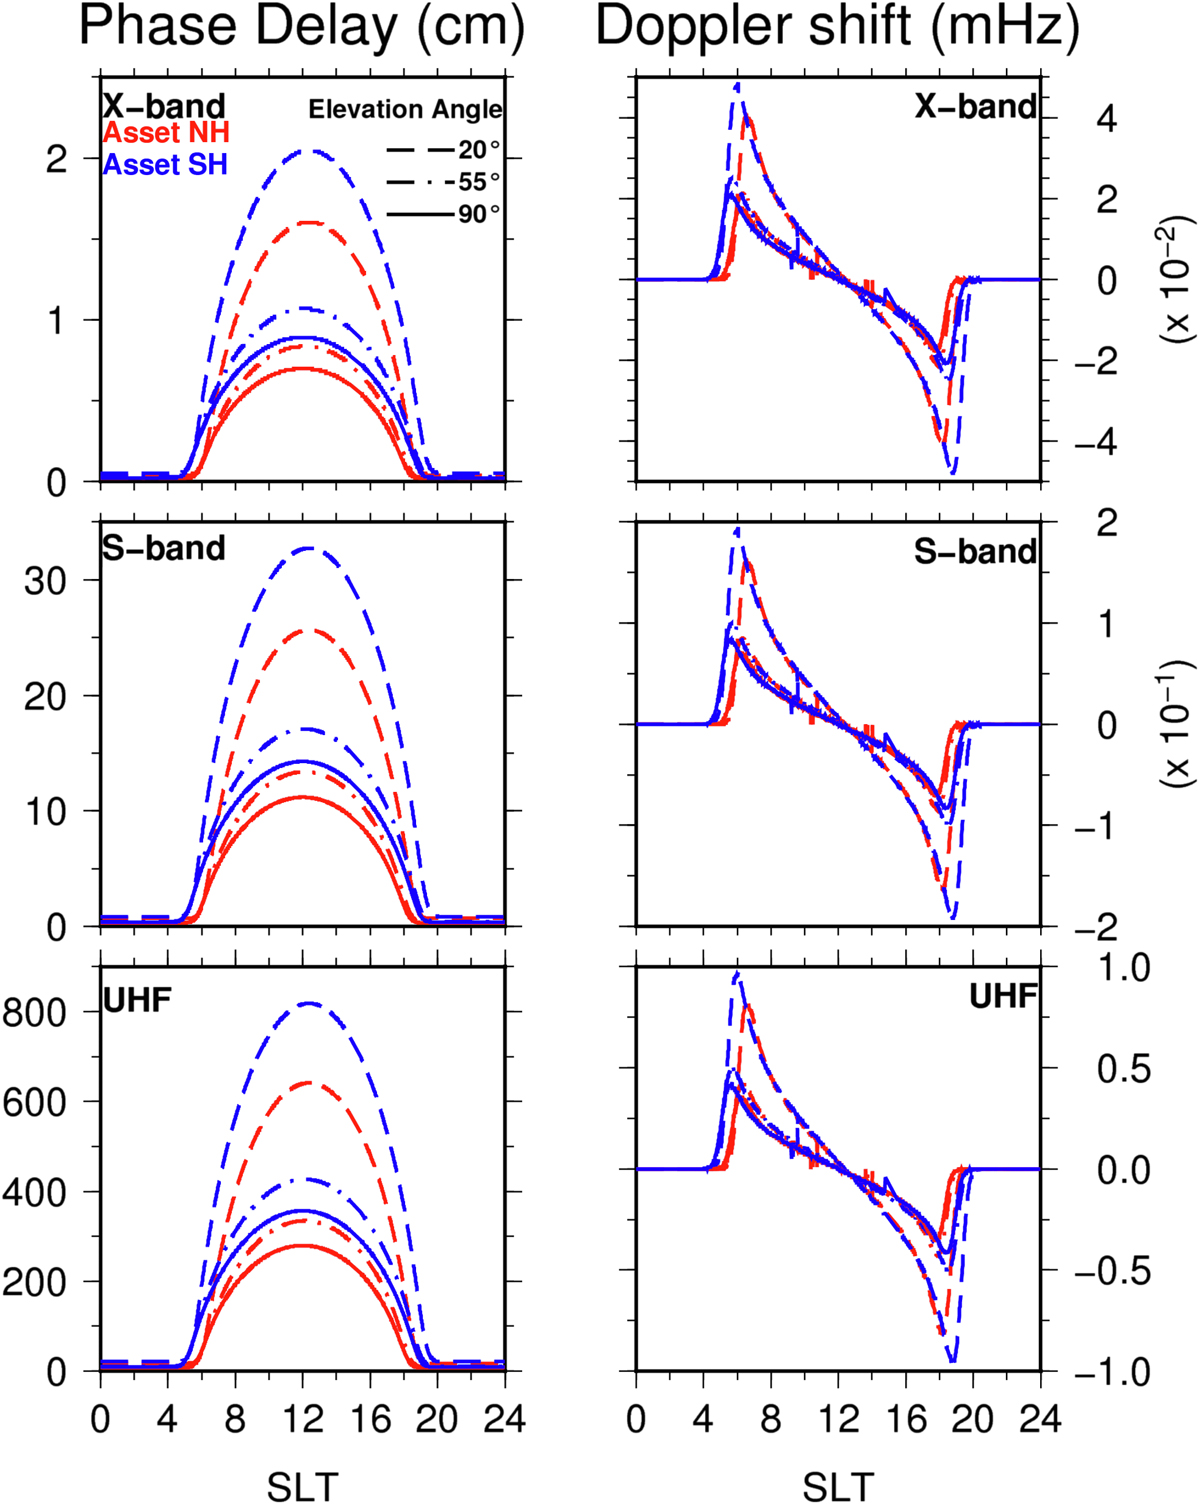
Effect of the Mars’ ionosphere on radio wave propagation. Effect on UHF (0.4 GHz, bottom), S-band (2 GHz, middle) and X-band (8 GHz, top) radio signals. Left: effect on phase delay in centimetres; Right: impact on instant Doppler shift in mHz (assuming dt = 1 s). The red curves correspond to an asset situated in the Northern Hemisphere (E0°, N10°) while the blue curves correspond to the one situated in the Southern Hemisphere (E0°, S10°). The bold, dashed-dots and dashed lines correspond to a LOS elevation of 90°, 55° and 20° respectively (see e the elevation on Fig. 9). The solar activity level is fixed at F10.7P = 120 sfu (moderate solar activity, see Fig. 1).
Current usage metrics show cumulative count of Article Views (full-text article views including HTML views, PDF and ePub downloads, according to the available data) and Abstracts Views on Vision4Press platform.
Data correspond to usage on the plateform after 2015. The current usage metrics is available 48-96 hours after online publication and is updated daily on week days.
Initial download of the metrics may take a while.


