Fig. 8
Download original image
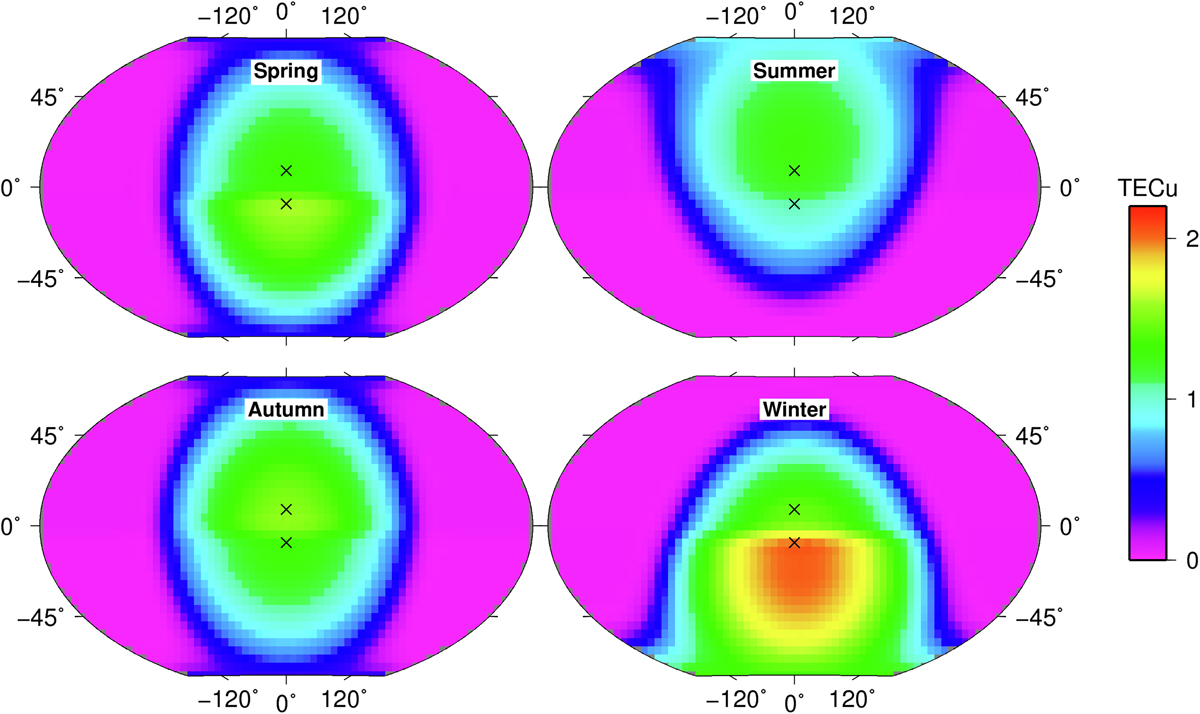
Global maps of Mars vTEC. The different maps correspond to the different outputs of the MoMo model for different seasons (in the North hemisphere) at local noon at the meridian origin. The F10.7P is fixed for a high solar activity level (170 sfu) corresponding to ![]() of 70 sfu for spring, 61 sfu for summer, 79 sfu for autumn and 88 sfu for winter. The black crosses are the location of two assets on the Mars surface (N10° and S10° in latitude; 0° in longitude) used in Figures 9 and 10.
of 70 sfu for spring, 61 sfu for summer, 79 sfu for autumn and 88 sfu for winter. The black crosses are the location of two assets on the Mars surface (N10° and S10° in latitude; 0° in longitude) used in Figures 9 and 10.
Current usage metrics show cumulative count of Article Views (full-text article views including HTML views, PDF and ePub downloads, according to the available data) and Abstracts Views on Vision4Press platform.
Data correspond to usage on the plateform after 2015. The current usage metrics is available 48-96 hours after online publication and is updated daily on week days.
Initial download of the metrics may take a while.