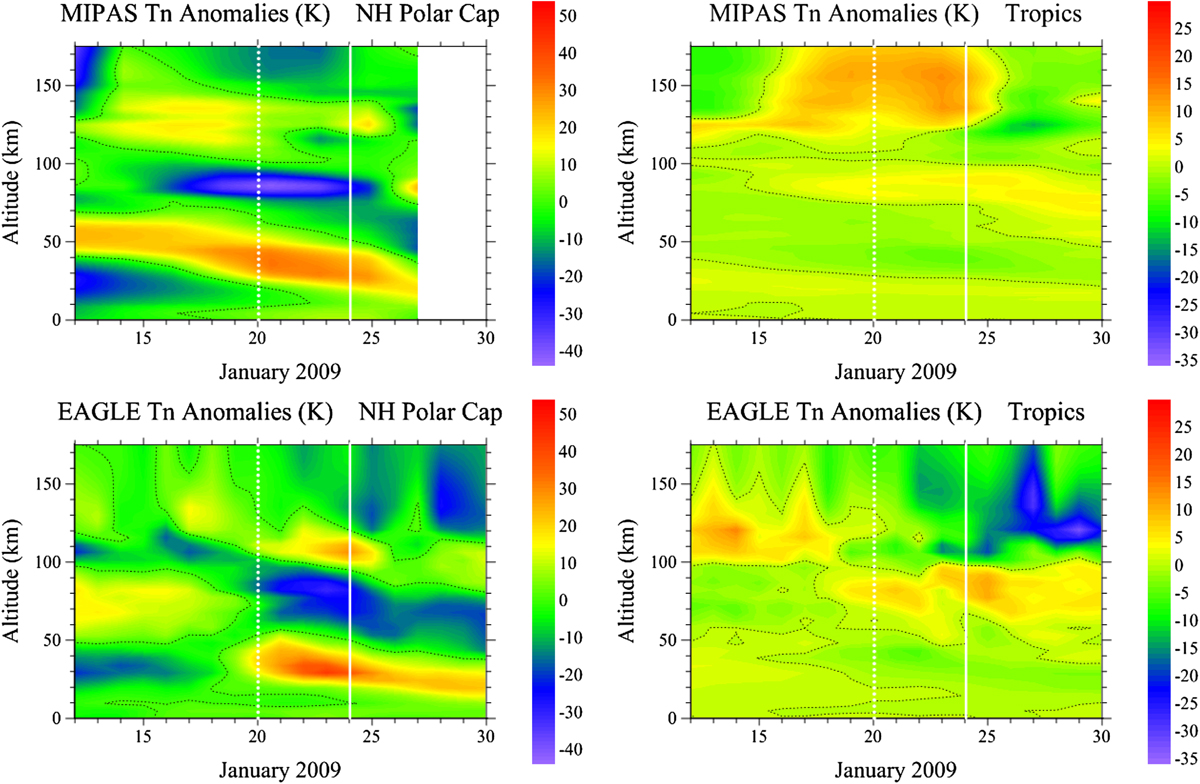
Fig. 1

Download original image
Day-to-day variability of zonal mean neutral temperature anomalies during January 2009 above the northern polar cap (70°–90° N, left panels) and above the tropics (20° S–20° N, right panels) obtained using MIPAS observational data (top) and EAGLE model results (bottom). Vertical lines indicate the onset (dotted) and peak (solid) of the 2009 SSW.
Current usage metrics show cumulative count of Article Views (full-text article views including HTML views, PDF and ePub downloads, according to the available data) and Abstracts Views on Vision4Press platform.
Data correspond to usage on the plateform after 2015. The current usage metrics is available 48-96 hours after online publication and is updated daily on week days.
Initial download of the metrics may take a while.


