Fig. 2
Download original image
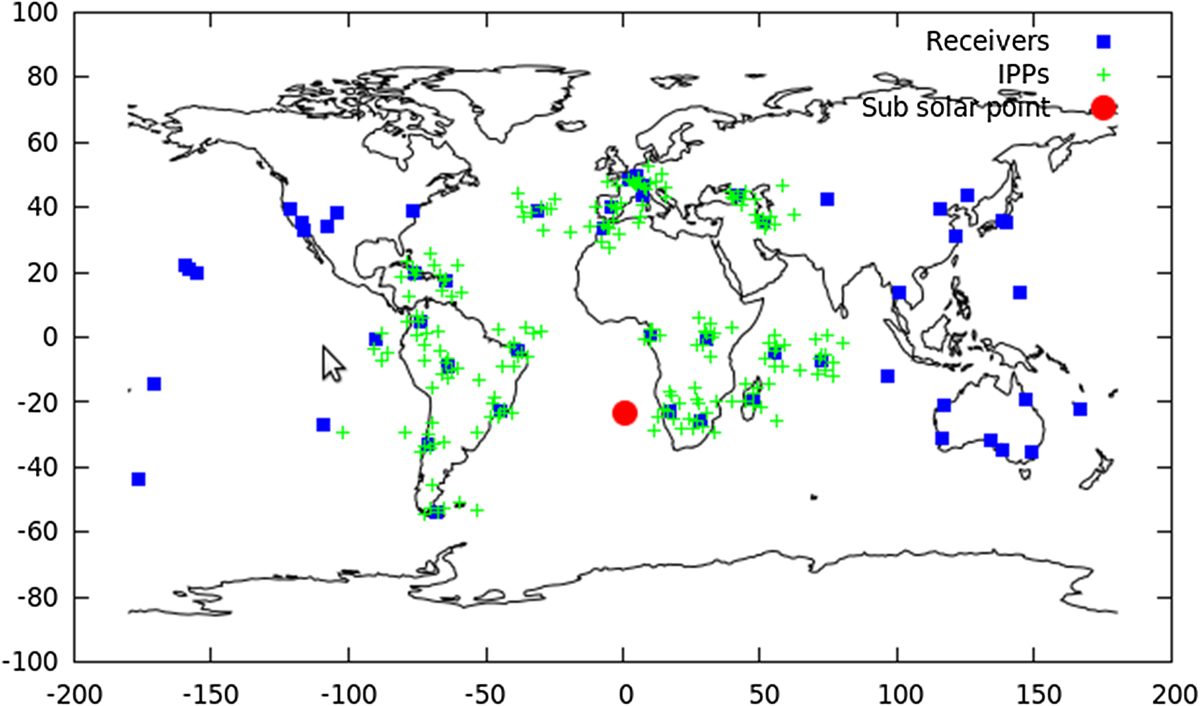
An example of the network of IGS – GNSS receivers (blue squares) and the IPPs (green crosses). The SSP is also indicated with a red circle. The example corresponds to DoY 365 in 2009 at 12.
Current usage metrics show cumulative count of Article Views (full-text article views including HTML views, PDF and ePub downloads, according to the available data) and Abstracts Views on Vision4Press platform.
Data correspond to usage on the plateform after 2015. The current usage metrics is available 48-96 hours after online publication and is updated daily on week days.
Initial download of the metrics may take a while.