Fig. 3

Download original image
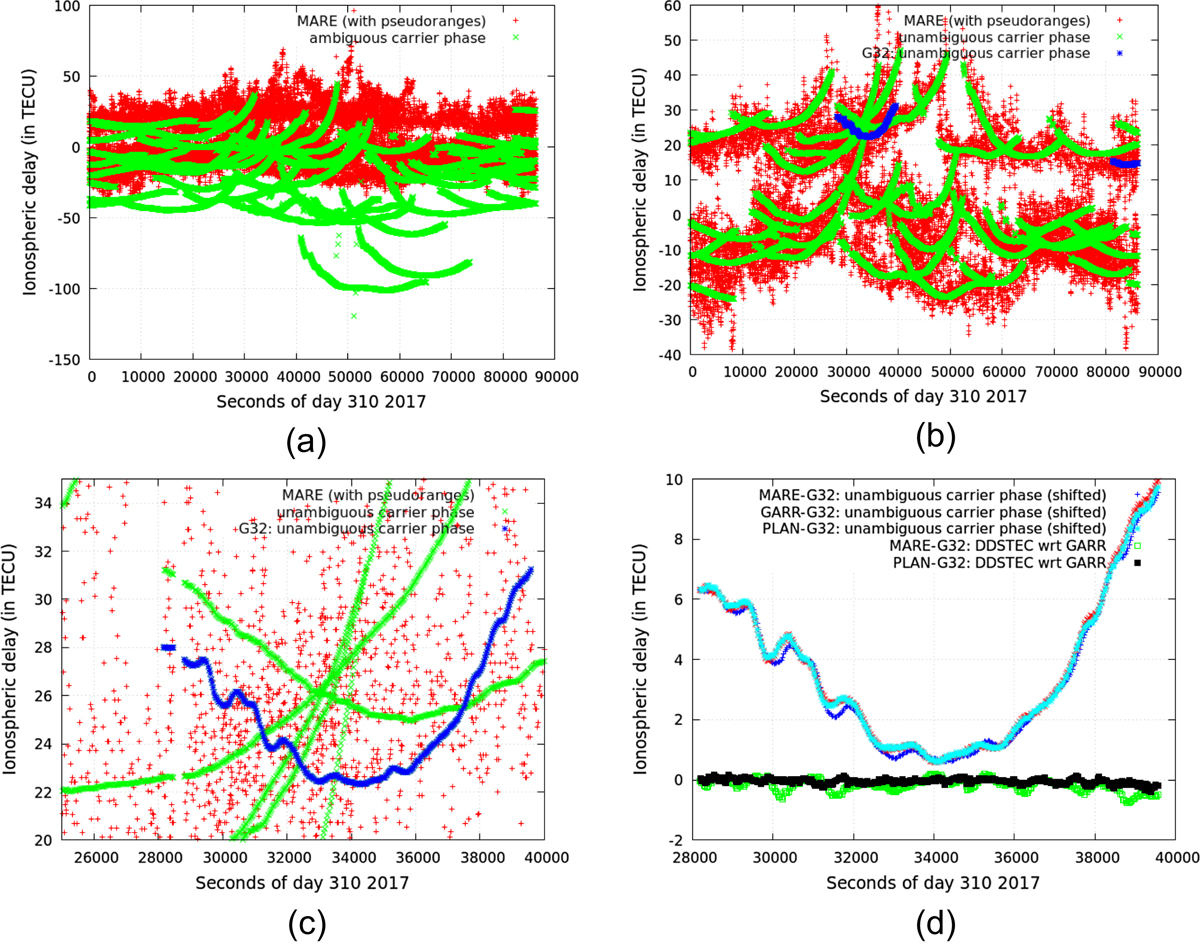
Top panels: example of the ionospheric delays measured with the carrier phases (green) and pseudoranges (red) corresponding to the receiver MARE during DoY 310 in 2017. The top left panel (a) displays the raw measurements. The top right panel (b) corresponds to the measurements where the carrier-phase ambiguities have been fixed. The ionospheric delay for the satellite G32, affected by a MSTID, is highlighted in blue. The bottom left panel (c) presents a more detailed picture of the MSTID event highlighted in panel (b). The bottom right panel (d) depicts the undifferenced STEC for the satellite G32 measured by receivers MARE (blue), GARR (red), and PLAN (cyan). The double differences of the ionospheric delays with respect to GARR are also depicted in green (MARE) and black (PLAN).
Current usage metrics show cumulative count of Article Views (full-text article views including HTML views, PDF and ePub downloads, according to the available data) and Abstracts Views on Vision4Press platform.
Data correspond to usage on the plateform after 2015. The current usage metrics is available 48-96 hours after online publication and is updated daily on week days.
Initial download of the metrics may take a while.


