Fig. 1
Download original image
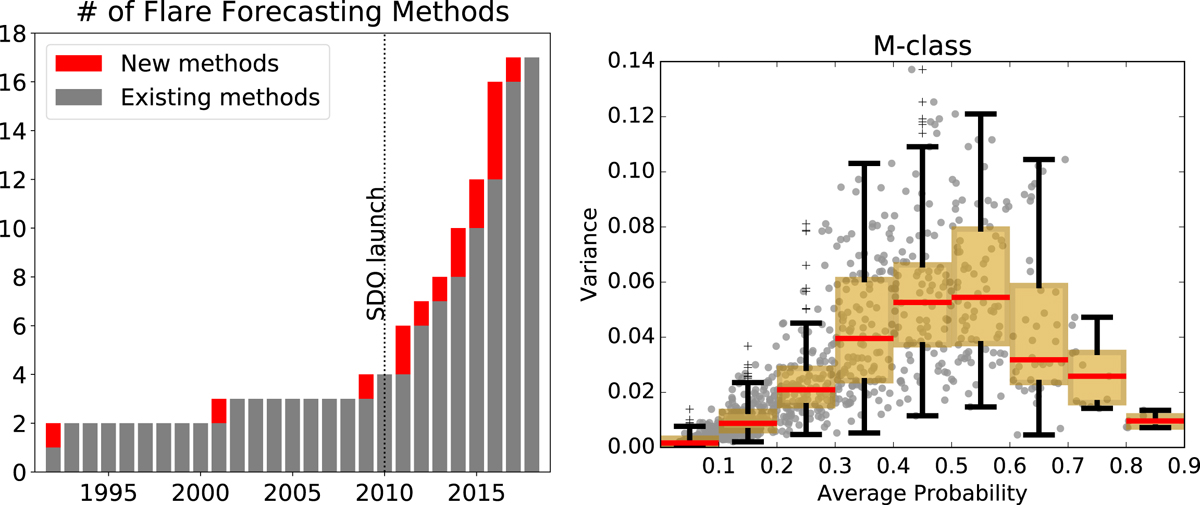
Left: Number of flare forecasting methods publicly available per year since 1992. For each year, existing methods (grey) and new methods (red) are displayed. Since 2010 the number of flare forecasting methods has increased at an average of approximately three every two years. This information was partially gathered from Leka et al. (2019), the NASA/GSFC Community Coordinated Modeling Center (CCMC) archive of forecasts, and other operational centre online archives. The earliest date when the first forecast was made available in these sources was used for the purposes of this figure. Right: forecast variance versus average forecast for a six-method group of probabilistic forecasts for M-class flares between 2015 and 2017. Variance is lower when the average forecast is closer to zero or one.
Current usage metrics show cumulative count of Article Views (full-text article views including HTML views, PDF and ePub downloads, according to the available data) and Abstracts Views on Vision4Press platform.
Data correspond to usage on the plateform after 2015. The current usage metrics is available 48-96 hours after online publication and is updated daily on week days.
Initial download of the metrics may take a while.