Fig. 3
Download original image
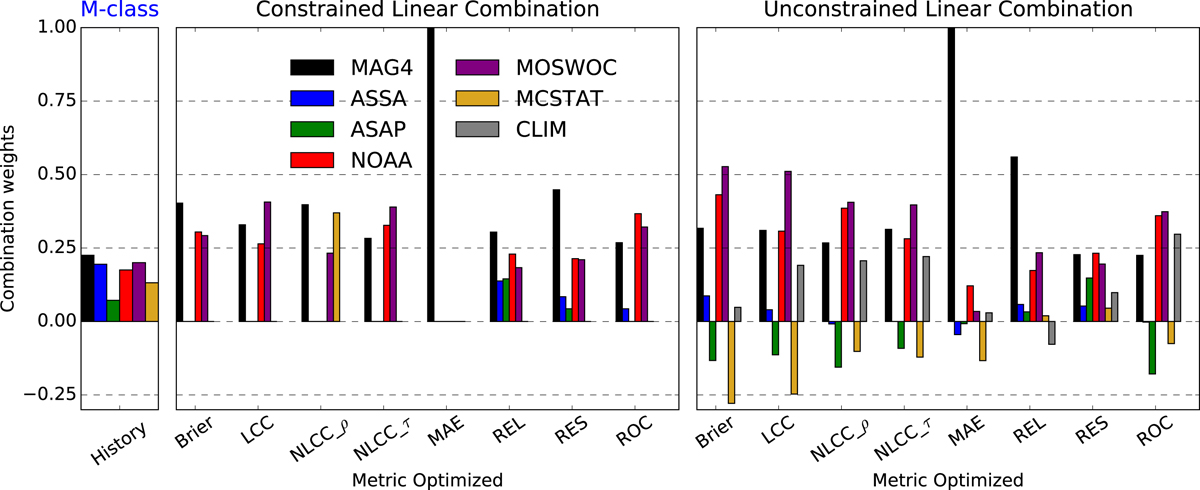
Ensemble combination weights for the optimization of probabilistic metrics (Table 3, left column) on M-class flare forecasts. Left panel corresponds to combination weights calculated from performance track (see text for details) while middle and right panels correspond to constrained and unconstrained linear combinations, respectively. Weights are presented using the same color scheme as Figure 2 for each forecast method member. Note, ULC weights corresponding to the climatological forecast member are displayed in gray in the right panel.
Current usage metrics show cumulative count of Article Views (full-text article views including HTML views, PDF and ePub downloads, according to the available data) and Abstracts Views on Vision4Press platform.
Data correspond to usage on the plateform after 2015. The current usage metrics is available 48-96 hours after online publication and is updated daily on week days.
Initial download of the metrics may take a while.