Fig. 5
Download original image
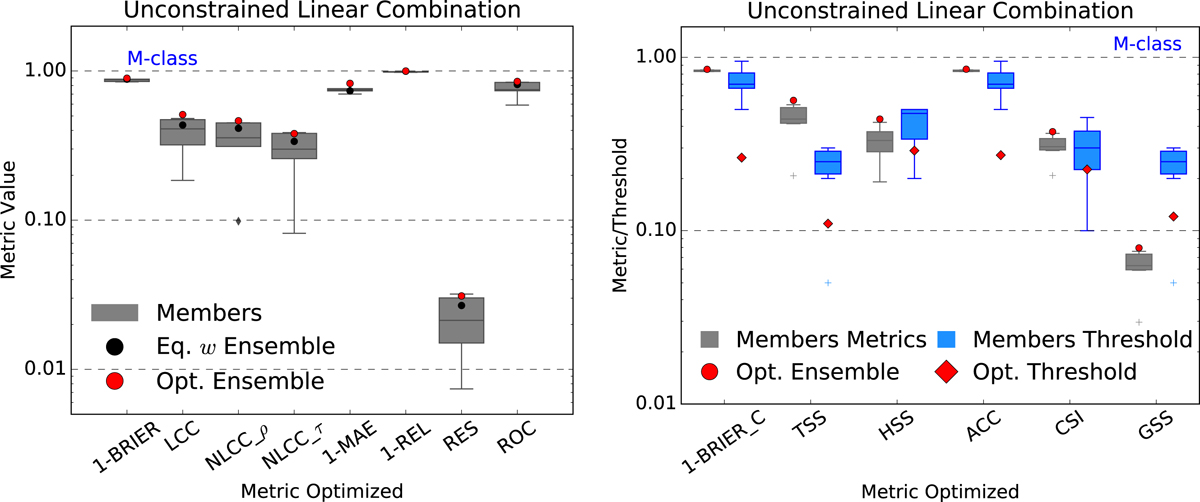
Left: For probabilistic metrics three values are shown per metric: (1) metrics values for ensemble members are displayed as box-and-whiskers; (2) the metric of the equal-weights ensemble (black circle); (3) the optimized (or best performing) ensemble (red circle). Right: metric and threshold values for categorical-metric ensembles. Gray and blue box-and-whiskers plots correspond to the ensemble members’ metrics and thresholds. Red circles and diamonds correspond to the optimized-ensemble metrics and thresholds. For better comparison, metrics in both panels that require minimization (i.e., BRIER, MAE, and REL) are displayed as 1− (metric value).
Current usage metrics show cumulative count of Article Views (full-text article views including HTML views, PDF and ePub downloads, according to the available data) and Abstracts Views on Vision4Press platform.
Data correspond to usage on the plateform after 2015. The current usage metrics is available 48-96 hours after online publication and is updated daily on week days.
Initial download of the metrics may take a while.