Fig. 6
Download original image
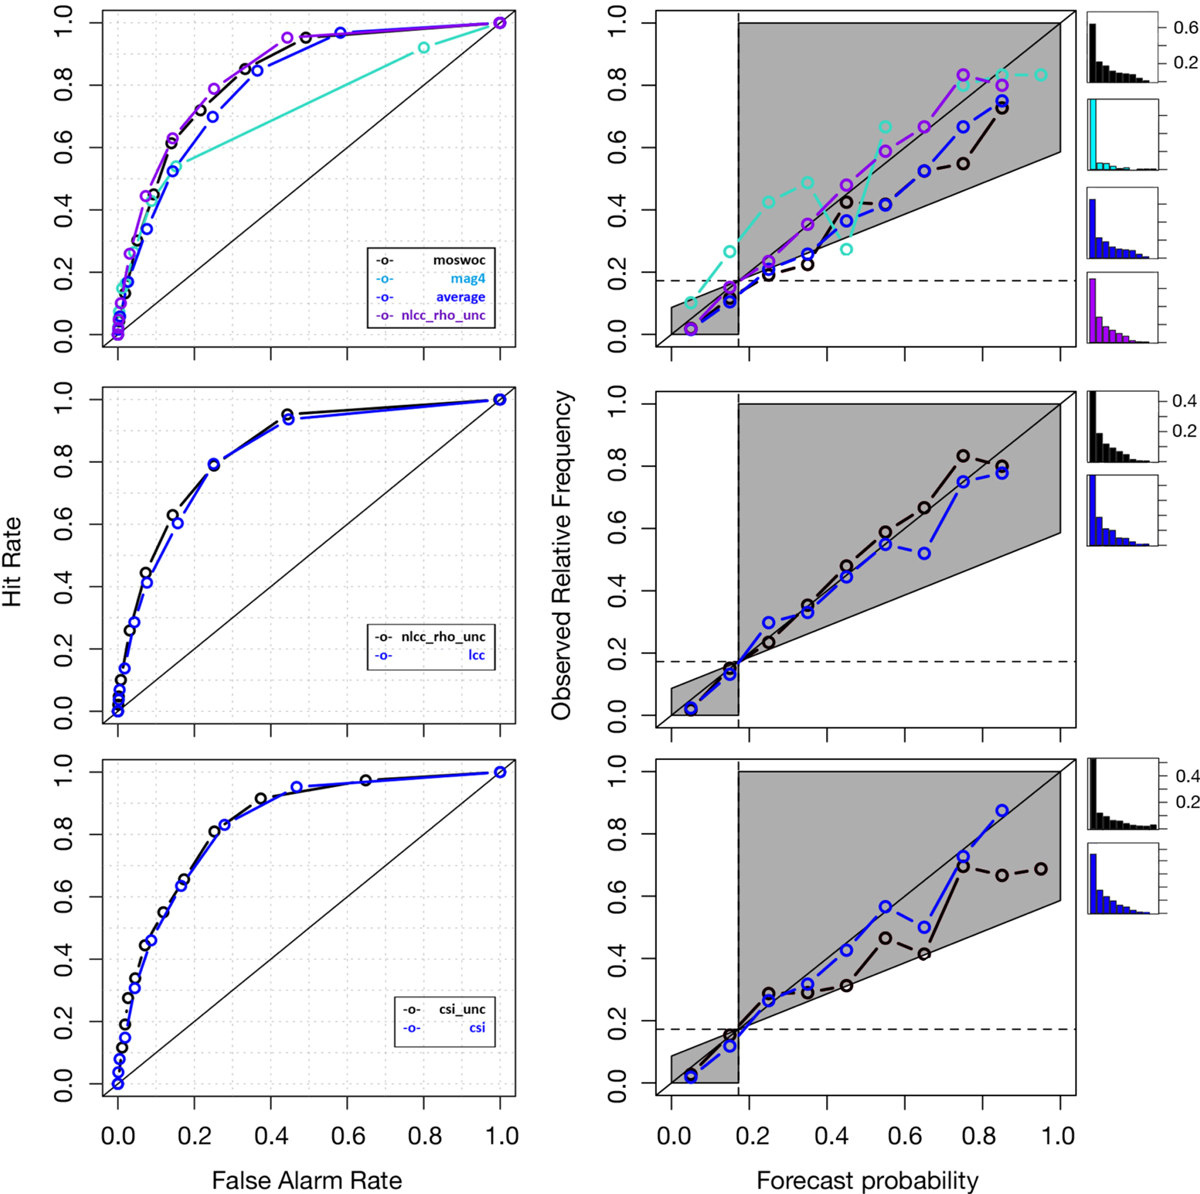
ROC curves (left column) and reliability diagrams (right column) for M-class flare forecasts, comparing the top ranking individual method types and final ensemble performer (upper row), and for constrained and unconstrained ensembles based on probabilistic (middle row) and categorical (lower row) metrics. Note that the center diagonal line in the ROC curves represents no skill, while for the reliability diagrams it indicates perfect reliability. The shaded areas in the reliability diagrams indicate regions that contribute positively to the Brier skill score (not shown/used here).
Current usage metrics show cumulative count of Article Views (full-text article views including HTML views, PDF and ePub downloads, according to the available data) and Abstracts Views on Vision4Press platform.
Data correspond to usage on the plateform after 2015. The current usage metrics is available 48-96 hours after online publication and is updated daily on week days.
Initial download of the metrics may take a while.