Open Access
Fig. 11
Download original image
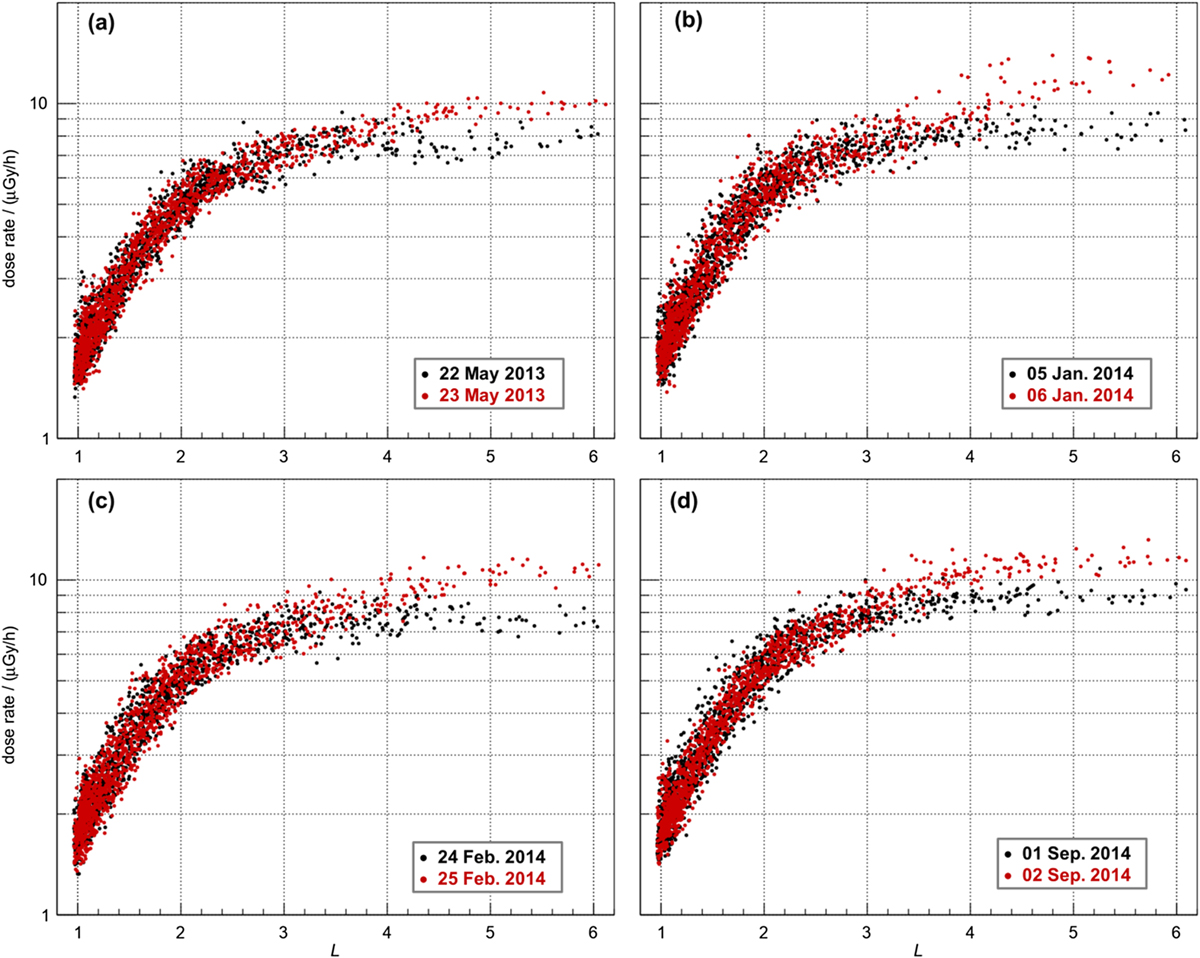
Dose rate versus L measured by the D3DD-2 instrument for (a) 22/23 May 2013; (b) 05/06 January 2014; (c) 24/25 February 2014; and (d) 01/02 September 2014. Note: Pre-event data are given in black and event data in red (see also Table 5).
Current usage metrics show cumulative count of Article Views (full-text article views including HTML views, PDF and ePub downloads, according to the available data) and Abstracts Views on Vision4Press platform.
Data correspond to usage on the plateform after 2015. The current usage metrics is available 48-96 hours after online publication and is updated daily on week days.
Initial download of the metrics may take a while.