Fig. 4

Download original image
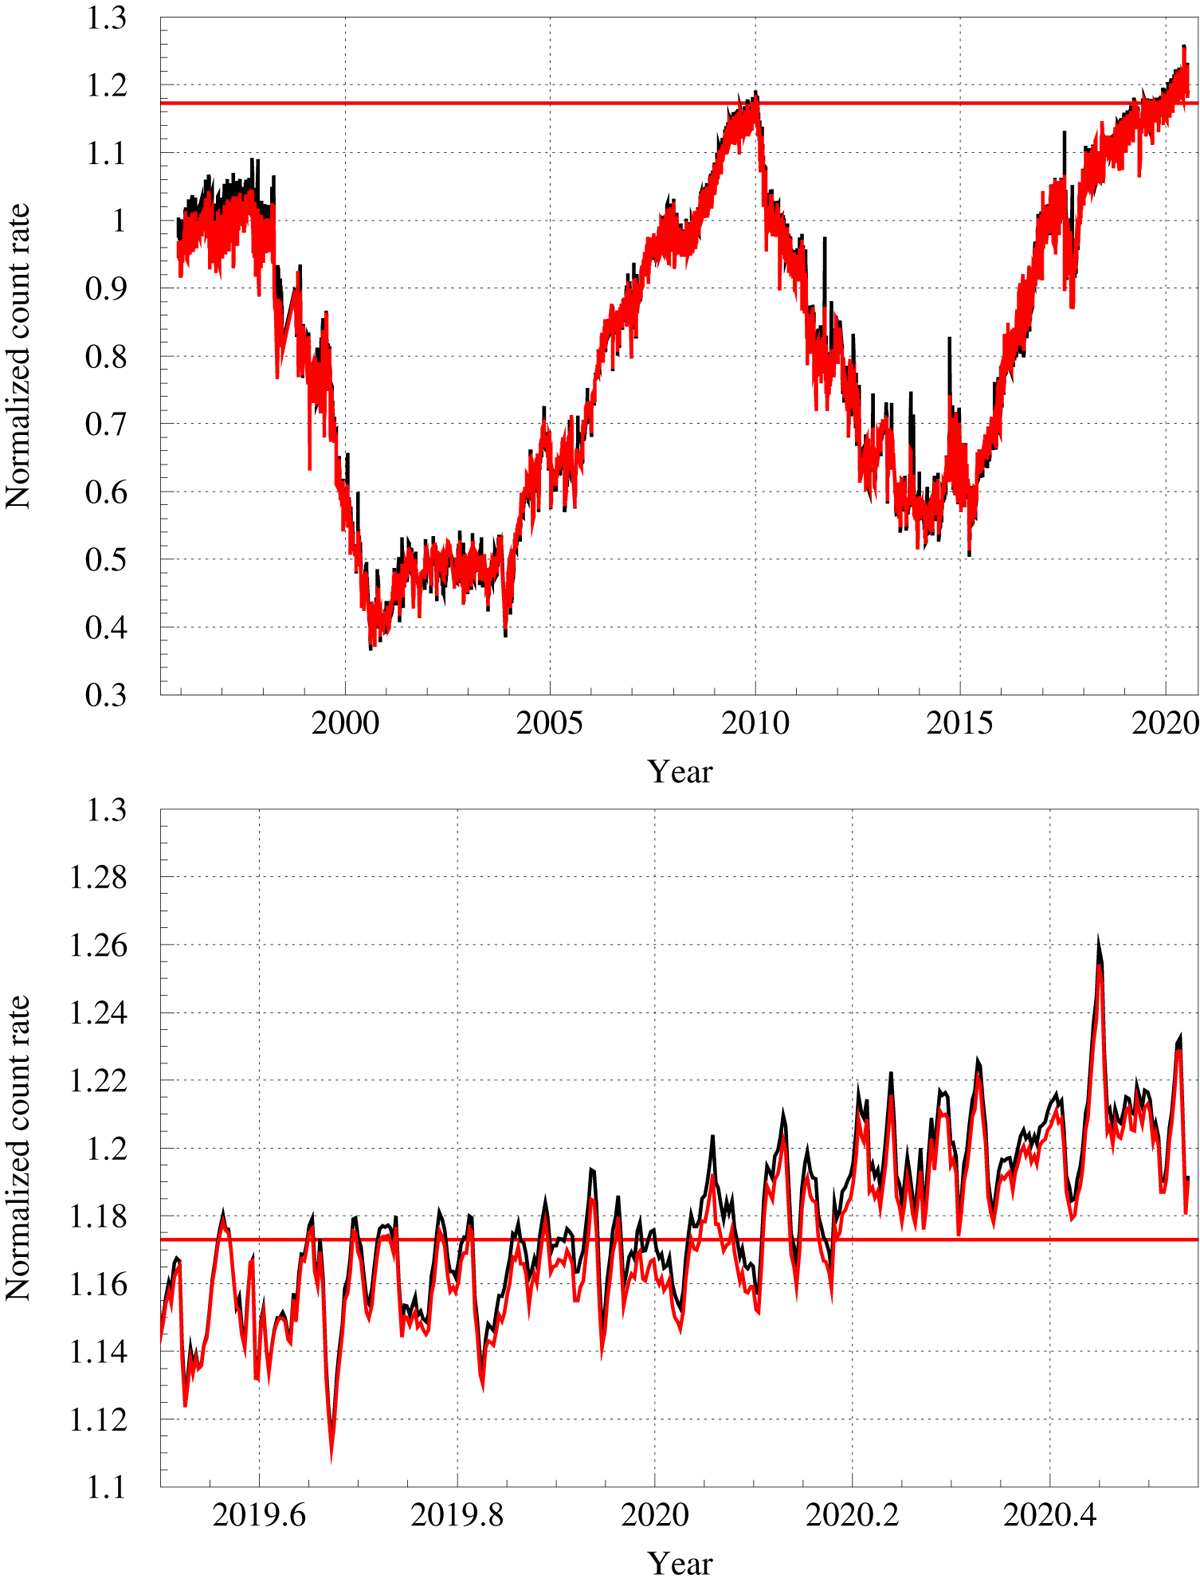
Uper and lower panel display the daily averaged quiet time galactic cosmic ray flux variation over the last two solar cycles and from July 2019 to July 2020, respectively. The black and red line show the count rate variation of the anti coincidence detector G and the SSD F using counting rate thresholds in SSD B omitting time periods of increased energetic particle fluxes (for details see text).
Current usage metrics show cumulative count of Article Views (full-text article views including HTML views, PDF and ePub downloads, according to the available data) and Abstracts Views on Vision4Press platform.
Data correspond to usage on the plateform after 2015. The current usage metrics is available 48-96 hours after online publication and is updated daily on week days.
Initial download of the metrics may take a while.


