Fig. 1
Download original image
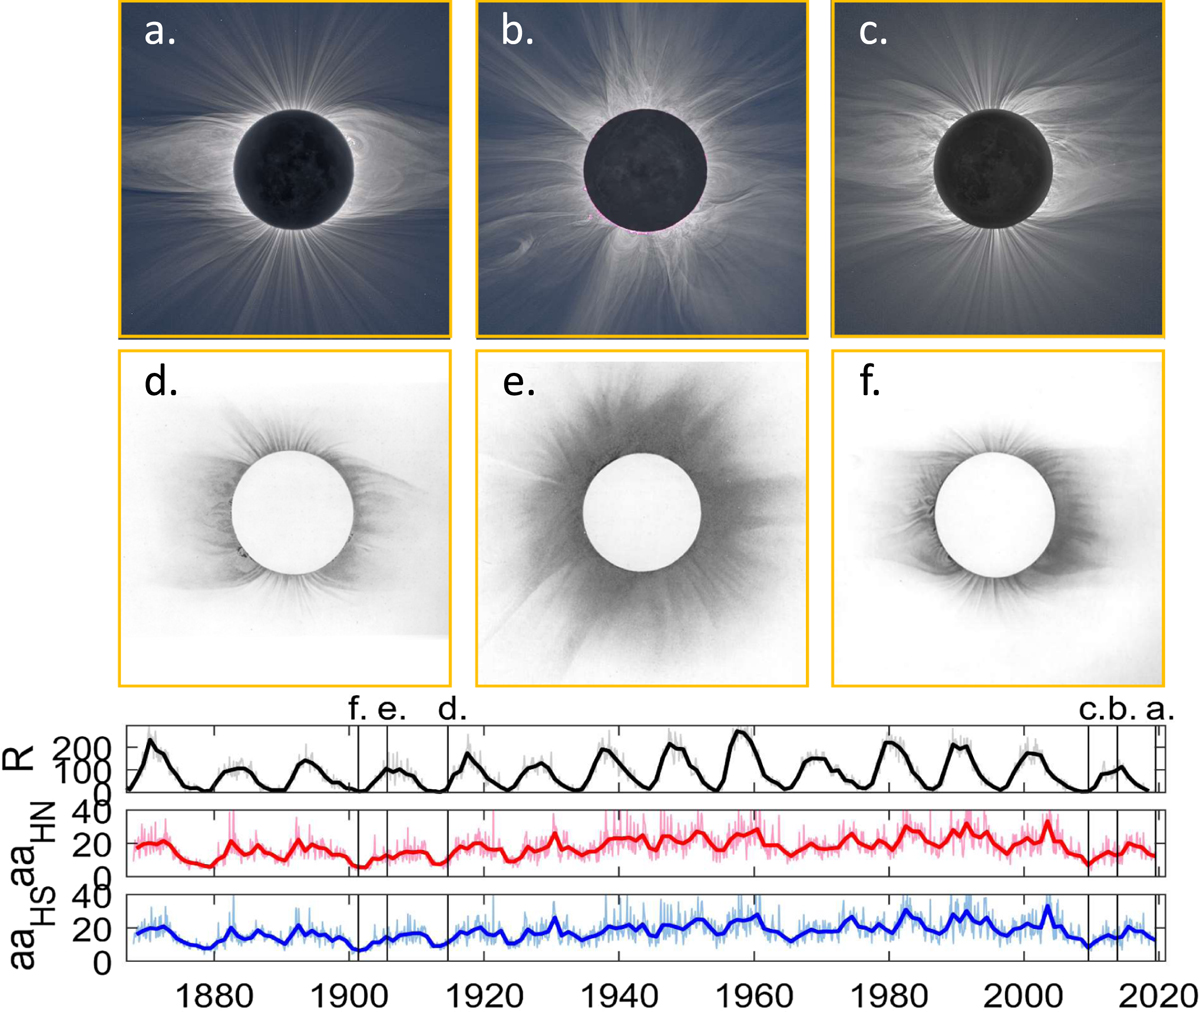
Eclipse images from solar cycles 14 and 24. Panels a, b, and c show images of eclipses at the end, maximum, and start of cycle 24 that have been processed by Miloslav Druckmüller of Brno University of Technology and are reproduced here with his kind permission: a is the eclipse of 2019 July 2 observed from Tres Cruses, Chile; b is the eclipse of 2013 November 3 observed from Pokwero, Uganda; and c is the eclipse of 2009 July 22 observed from Enewetak Atoll, Marshall Islands. Further details of observers and equipment used are available from http://www.zam.fme.vutbr.cz/~druck/eclipse/. Panels d, e, and f show images of eclipses at the end, maximum and start of cycle 14 that were recorded onto photographic plates and then transcribed onto paper by William Henry Wesley and Miss A. Crommelin to enable reproduction. d is the eclipse of 1914 August 21 observed from Minsk, Russian Empire; e is the eclipse of 1905 August 30 observed from Sfax, Tunisia; and f is the eclipse of 1901 May 18 observed from Pamplemousses, Mauritius. Details of the observers and the equipment used are given in Dyson (1927). The bottom three panels show variations of the (revised) International Sunspot Number (Clette & Lefèvre, 2016), the northern hemisphere aaH index, aaHN, and the southern hemisphere aaH index, aaHS (Lockwood et al., 2018a, 2018b) in each panel the paler-coloured thin line shows monthly mean values and the deeper-coloured thick line the annual means. The vertical lines mark the times of the eclipses shown.
Current usage metrics show cumulative count of Article Views (full-text article views including HTML views, PDF and ePub downloads, according to the available data) and Abstracts Views on Vision4Press platform.
Data correspond to usage on the plateform after 2015. The current usage metrics is available 48-96 hours after online publication and is updated daily on week days.
Initial download of the metrics may take a while.