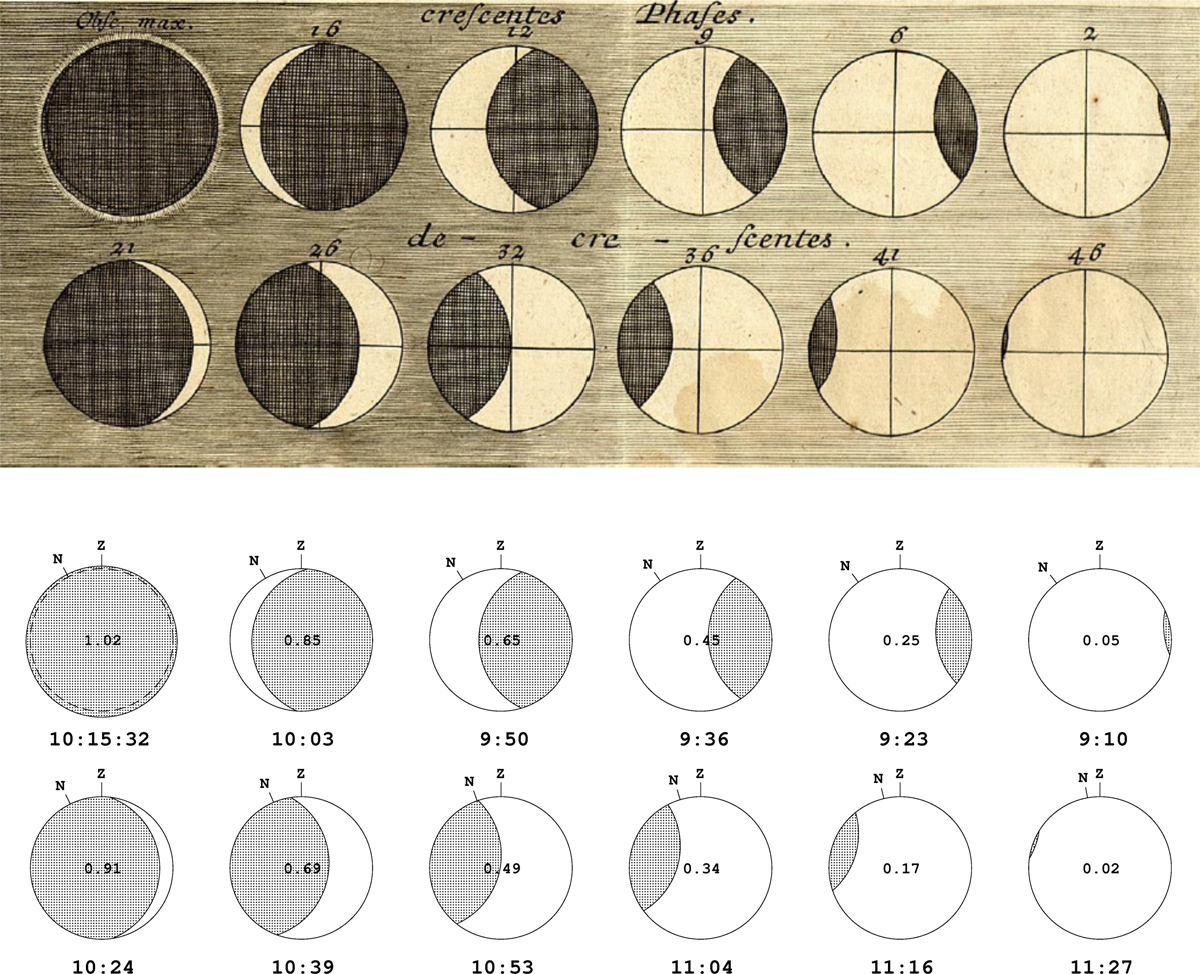
Fig. 10
Download original image
Wurzelbau’s drawings to show time series of the eclipse magnitude (Wurzelbau, 1706, p. 14), shown above. Unlike other images, these images are specialised to the magnitude of eclipse and only brightest part of its corona is described, obscuring and reflecting the solar disk; the calculated corresponding eclipse phases with LAT are shown below.
Current usage metrics show cumulative count of Article Views (full-text article views including HTML views, PDF and ePub downloads, according to the available data) and Abstracts Views on Vision4Press platform.
Data correspond to usage on the plateform after 2015. The current usage metrics is available 48-96 hours after online publication and is updated daily on week days.
Initial download of the metrics may take a while.