Fig. 16
Download original image
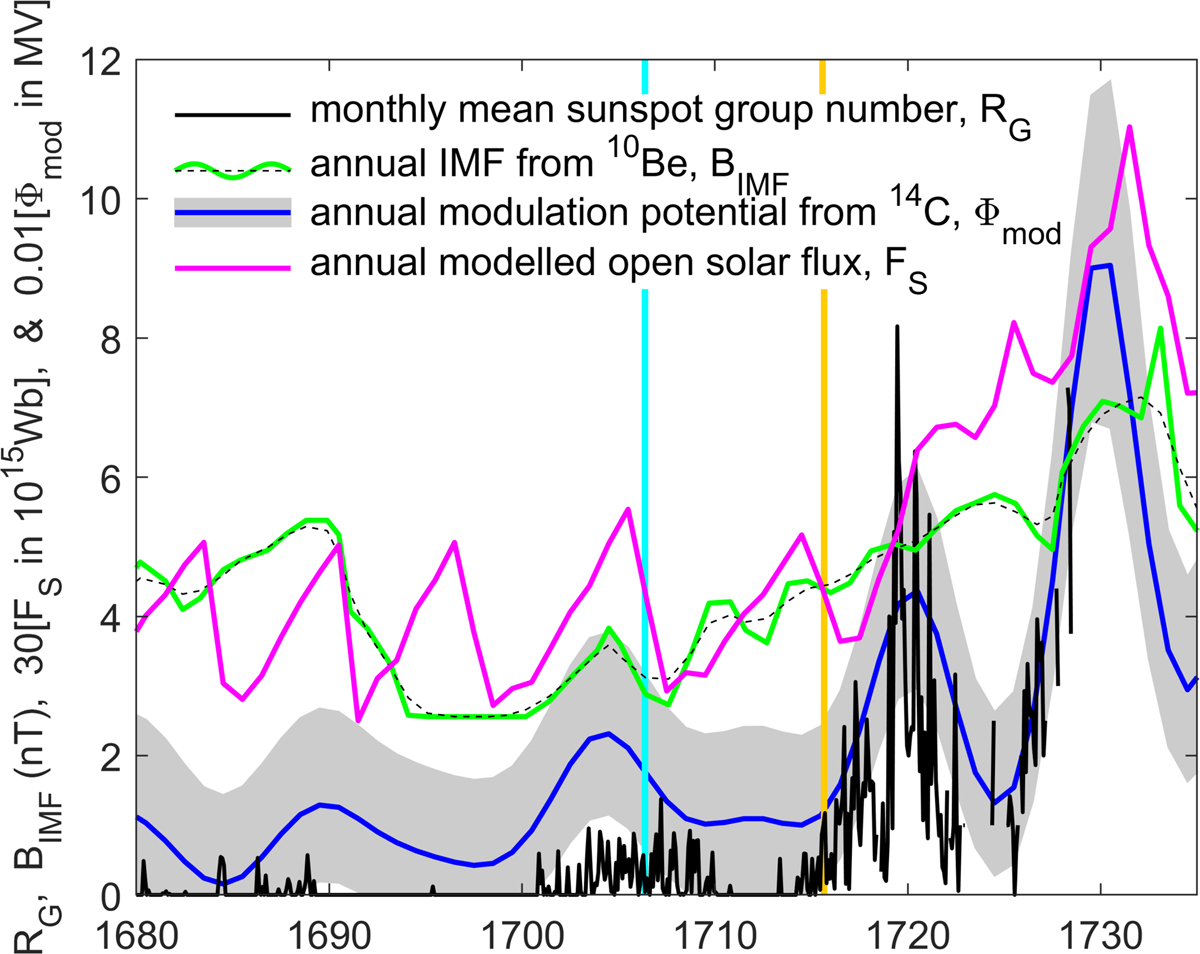
The emergence of the solar activity from the MM in the “recovery phase”. The black line gives the monthly means, RG, of daily group sunspot numbers by Vaquero et al. (2016): note that values are only given for months in which more than 15 days of observations were available. The green line shows monthly mean of the near-Earth interplanetary magnetic field, BIMF, derived by McCracken & Beer (2015) from the 10Be cosmogenic isotope abundances from the Dye-3 ice-core and North Greenland Ice Core Project (NGRIP), both from Greenland (Beer et al., 1998; Berggren et al., 2009): the black dashed line is the same data passed through a 1-4-6-4-1 filter. The blue line gives annual means of the heliospheric modulation potential, Φmod, derived from both the 14C and 10Be cosmogenic isotopes: the surrounding area gives the 2-sigma uncertainty band (Muscheler et al., 2007). The mauve line is the open solar flux, FS, modelled by Lockwood & Owens (2014) from sunspot numbers. The vertical cyan and orange lines mark the times of the 1706 and 1715 eclipses, respectively.
Current usage metrics show cumulative count of Article Views (full-text article views including HTML views, PDF and ePub downloads, according to the available data) and Abstracts Views on Vision4Press platform.
Data correspond to usage on the plateform after 2015. The current usage metrics is available 48-96 hours after online publication and is updated daily on week days.
Initial download of the metrics may take a while.