Fig. 18
Download original image
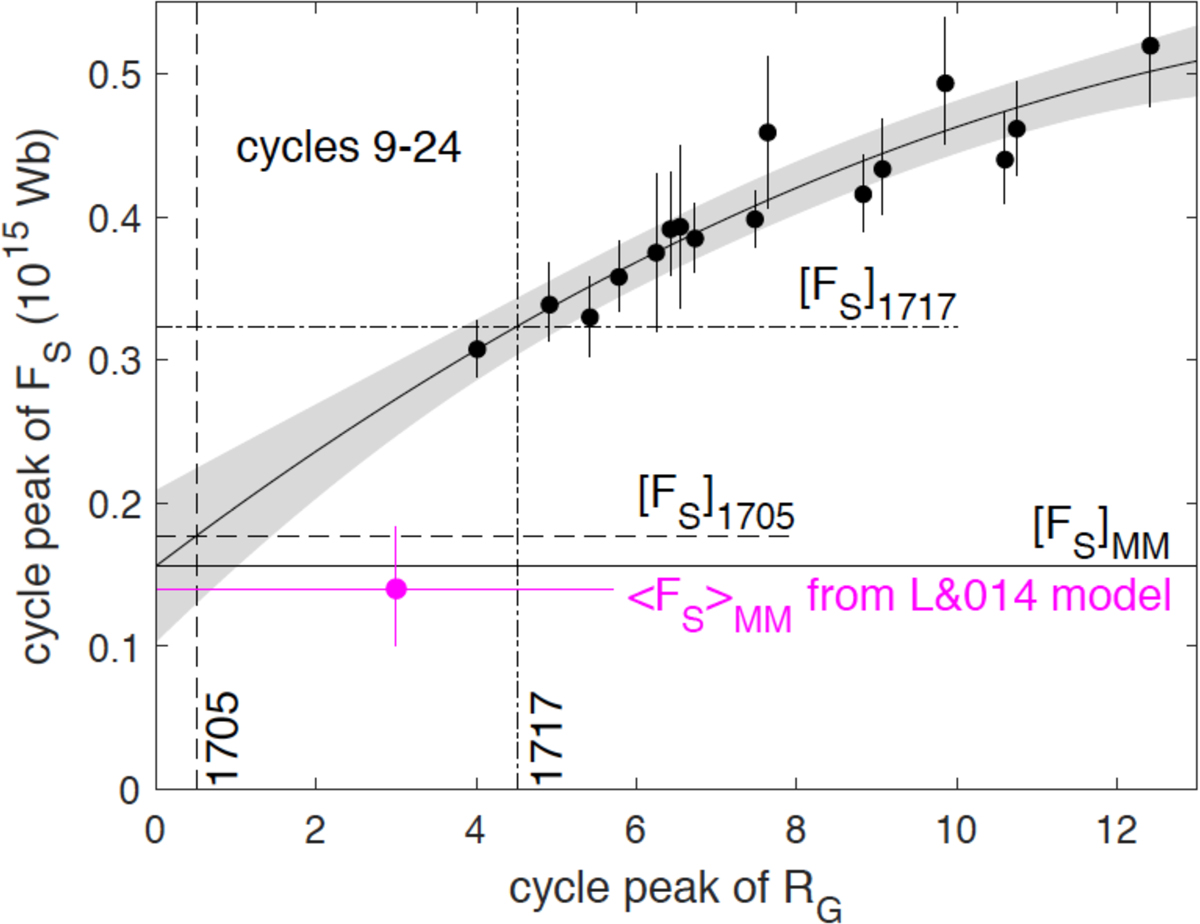
The points show the peak open solar flux, FS, derived from 4 combinations of different geomagnetic activity indices by Lockwood et al. (2014a) as a function of the peak group sunspot number, RG, compiled by Vaquero et al. (2016) for solar cycles 9–24. The black line is a 2nd-order polynomial fit to these data and the surrounding grey area is plus and minus the error in this fit, at the 1-sigma level. Extrapolating this simple empirical relationship to RG = 0 gives a value for the OSF in the Maunder Minimum, [FS]MM which is consistent with the average for the MM from the modelling of Lockwood and Owens (2014), shown by the mauve line. (Note the vertical mauve line gives the range of variation in this modelled value caused by the model allowing for cyclic variation in the OSF loss rate in the Maunder Minimum). From the empirical fit are scaled the values of the open flux at the peak of the extremely weak and disordered sunspot cycle around 1705, [FS]1706 and at the peak of the much stronger and more ordered cycle that followed it and peaked in 1717, [FS]1717. This is the cycle in which the 1715 eclipse occurred and is like a modern cycle in terms of its OSF levels, sunspots numbers, sunspots being both solar hemispheres and showing a butterfly progression of spots from high to low heliographic latitudes.
Current usage metrics show cumulative count of Article Views (full-text article views including HTML views, PDF and ePub downloads, according to the available data) and Abstracts Views on Vision4Press platform.
Data correspond to usage on the plateform after 2015. The current usage metrics is available 48-96 hours after online publication and is updated daily on week days.
Initial download of the metrics may take a while.