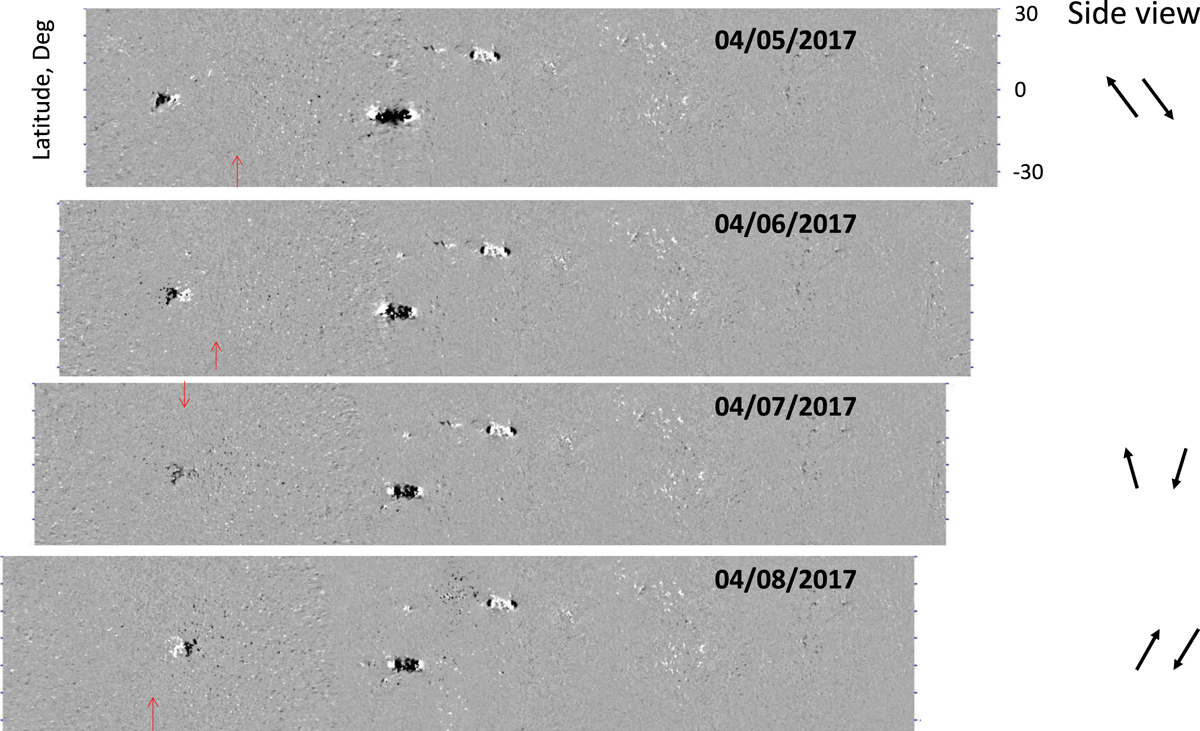
Fig. 3
Download original image
(Left) Changes in the pattern of the zonal (East–West) vector-field component of a small bipolar region over its disk passage. Four panels show the so-called near real time (NRT) synoptic maps. White/black halftones correspond to magnetic field directed towards the West/East. Each NRT map covers 360° in longitude (horizontal direction) and approximately ±30° in latitude (vertical direction). The most recent data are added onto the left side of synoptic maps. The dates of the most recent observations added to synoptic map are shown in the upper-right corner of each panel. For visual clarity, the synoptic charts are shifted to have the active regions aligned in the vertical direction. Small red arrows plotted in the left part of each panel correspond to the approximate location of the central meridian for the day of observations. Panels on the right show a schematic inclination pattern of the magnetic field vectors in a vertical East–West oriented plane (as if we were looking at an active region from the side).
Current usage metrics show cumulative count of Article Views (full-text article views including HTML views, PDF and ePub downloads, according to the available data) and Abstracts Views on Vision4Press platform.
Data correspond to usage on the plateform after 2015. The current usage metrics is available 48-96 hours after online publication and is updated daily on week days.
Initial download of the metrics may take a while.