Fig. 14
Download original image
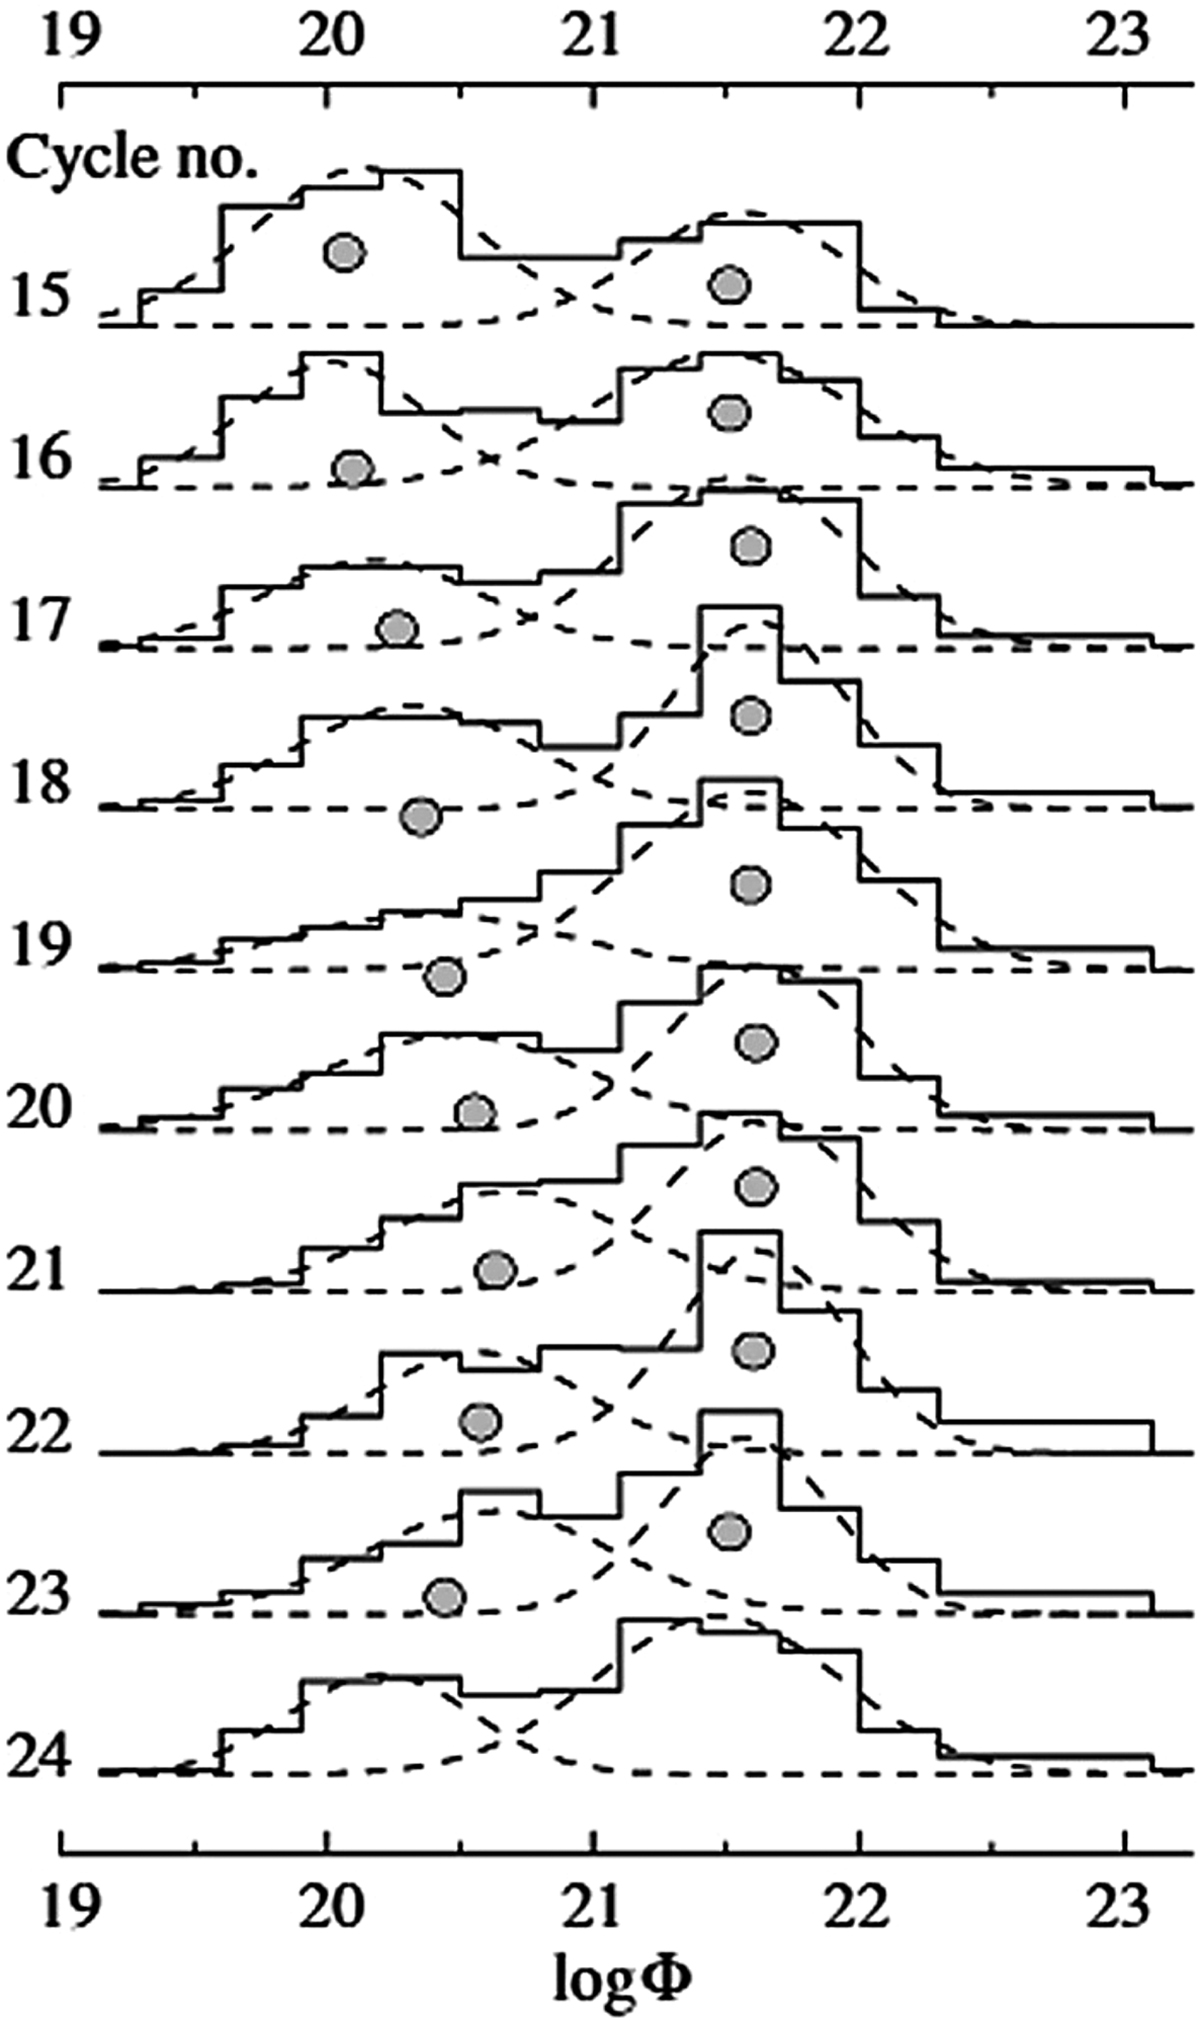
The PDF of proxy of the magnetic flux Φ (in units of Maxwell) based on sunspot area for solar cycles 15–24. Dashed lines show the Gaussian fit to two components of sunspot populations, and the filled circles mark the maximum of each fitted distribution. Reproduced from Nagovitsyn et al. (2016).
Current usage metrics show cumulative count of Article Views (full-text article views including HTML views, PDF and ePub downloads, according to the available data) and Abstracts Views on Vision4Press platform.
Data correspond to usage on the plateform after 2015. The current usage metrics is available 48-96 hours after online publication and is updated daily on week days.
Initial download of the metrics may take a while.