Fig. 7
Download original image
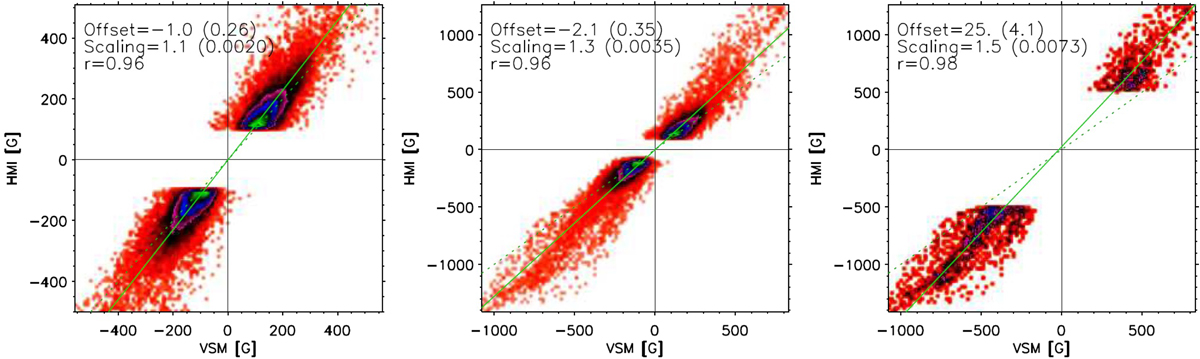
Pixel-by-pixel comparison of VSM and HMI longitudinal magnetograms observed on 14 November 2011. The HMI magnetogram was spatially smoothed to match VSM resolution. Three panels show scatter plots for various flux ranges (color scale for scatter plots is logarithmic). Shown in solid line is computed fit and in dotted line scaling factor equal unity and zero offset fit. Computed fit (scaling factor and offset, fit standard deviation in parentheses) and Pearson correlation coefficient are given in upper left corner of each panel. Reproduced from Pietarila et al. (2013).
Current usage metrics show cumulative count of Article Views (full-text article views including HTML views, PDF and ePub downloads, according to the available data) and Abstracts Views on Vision4Press platform.
Data correspond to usage on the plateform after 2015. The current usage metrics is available 48-96 hours after online publication and is updated daily on week days.
Initial download of the metrics may take a while.