Open Access
Fig. 17
Download original image
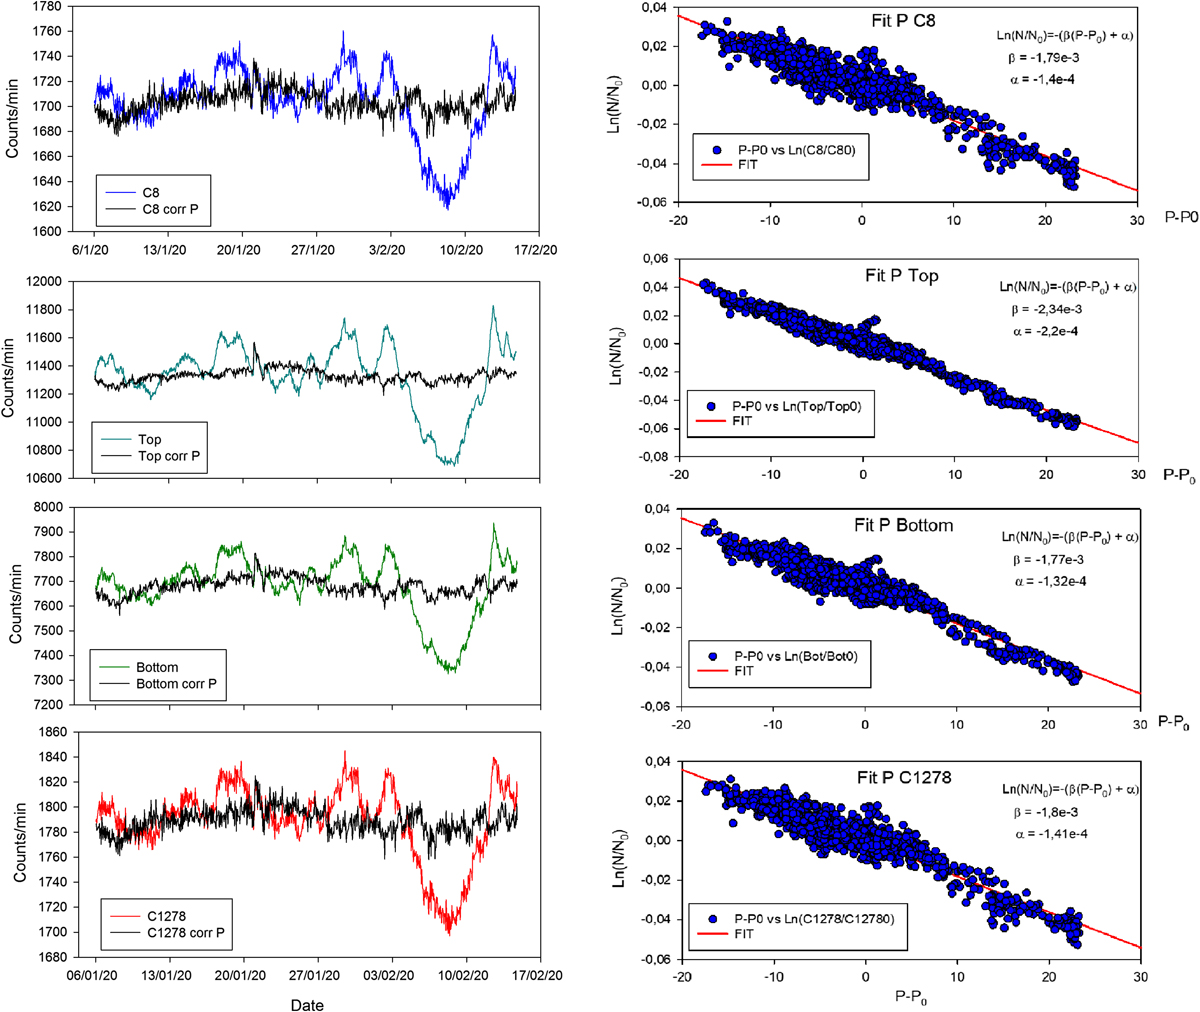
On the left panel, the hourly count rate for data taken from January 6th to February 14th, 2020 for the four coincidence channels. Original signals (in color) and corrected pressure signals (in black). On the right, the four fitting plots to obtain the pressure adjusting parameters.
Current usage metrics show cumulative count of Article Views (full-text article views including HTML views, PDF and ePub downloads, according to the available data) and Abstracts Views on Vision4Press platform.
Data correspond to usage on the plateform after 2015. The current usage metrics is available 48-96 hours after online publication and is updated daily on week days.
Initial download of the metrics may take a while.