Fig. 6
Download original image
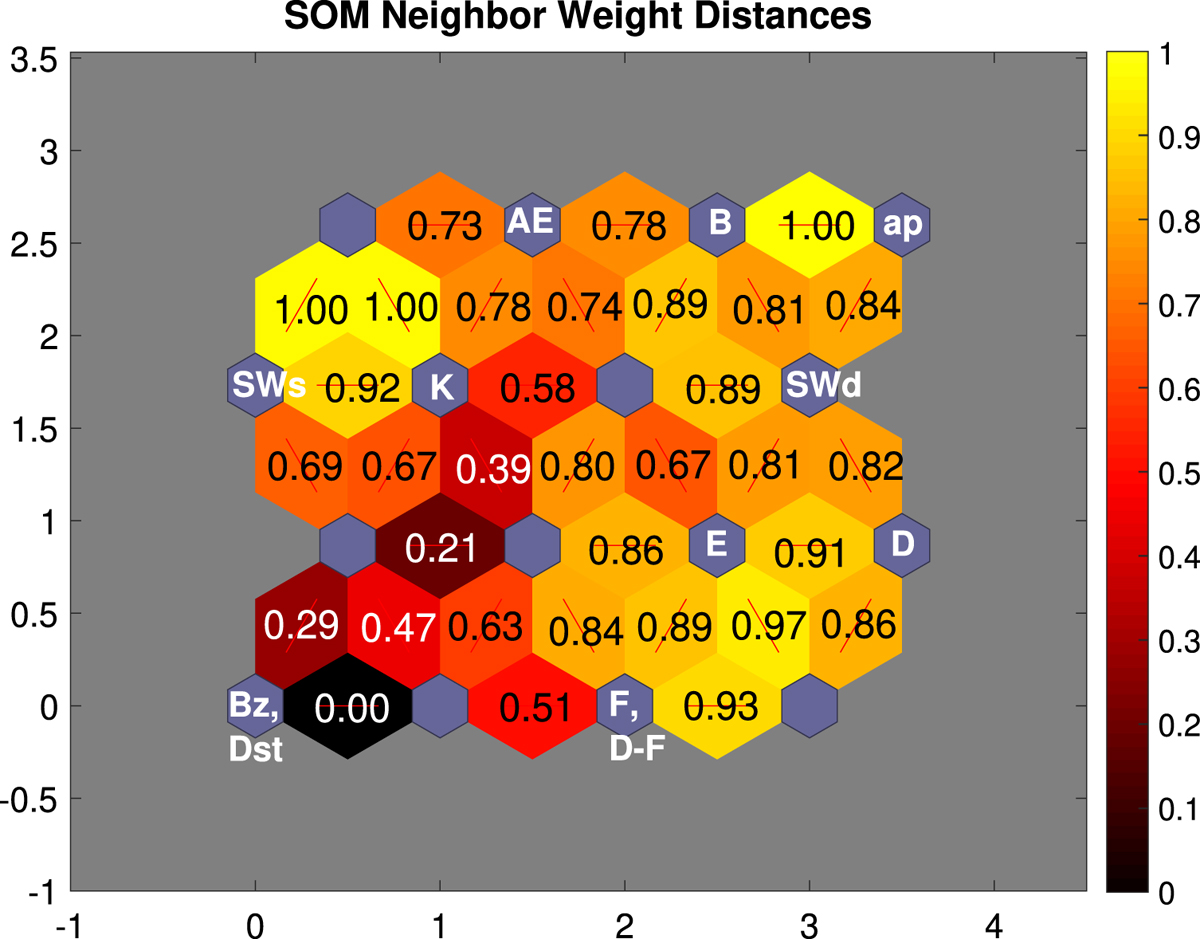
SOM neighbor weight distances with weight values of connections between neighboring neurons for data without delay for the intense geomagnetic storm, 15 July 2012. The blue hexagons represent neurons, and the red lines show which particular neurons are connected. Colors from black to yellow display the weight values of the connection between neighboring neurons.
Current usage metrics show cumulative count of Article Views (full-text article views including HTML views, PDF and ePub downloads, according to the available data) and Abstracts Views on Vision4Press platform.
Data correspond to usage on the plateform after 2015. The current usage metrics is available 48-96 hours after online publication and is updated daily on week days.
Initial download of the metrics may take a while.