Fig. 8
Download original image
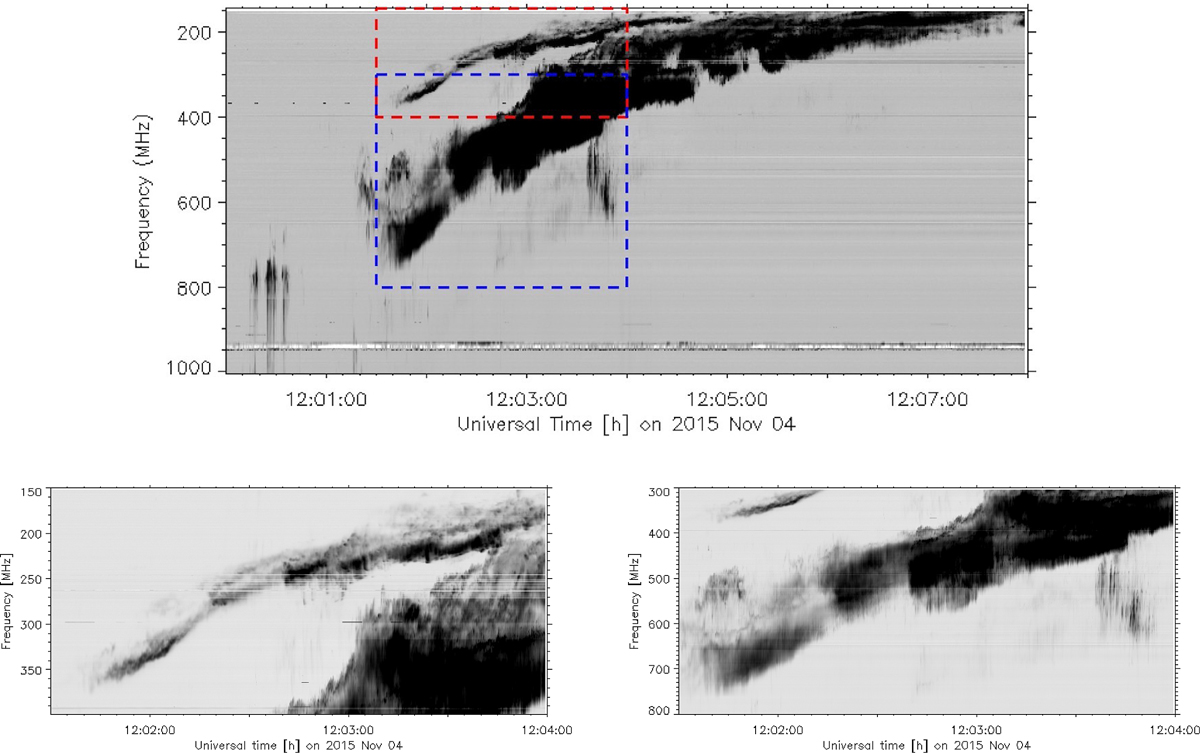
Top: Dynamic spectrum of a type II burst on 2015 Nov 04 from 144 to 1000 MHz, showing fundamental and harmonic bands. The overlaid rectangles delimit parts of the fundamental (red) and harmonic (blue) band. Bottom: Dynamic spectra in the ranges delimited by the red (left panel) and blue (right panel) rectangles in the top panel. The frequency axes of the two plots have a ratio of 2:1. A reference profile (mean from 12:00 to 12:01 UT) has been subtracted.
Current usage metrics show cumulative count of Article Views (full-text article views including HTML views, PDF and ePub downloads, according to the available data) and Abstracts Views on Vision4Press platform.
Data correspond to usage on the plateform after 2015. The current usage metrics is available 48-96 hours after online publication and is updated daily on week days.
Initial download of the metrics may take a while.