Fig. 8

Download original image
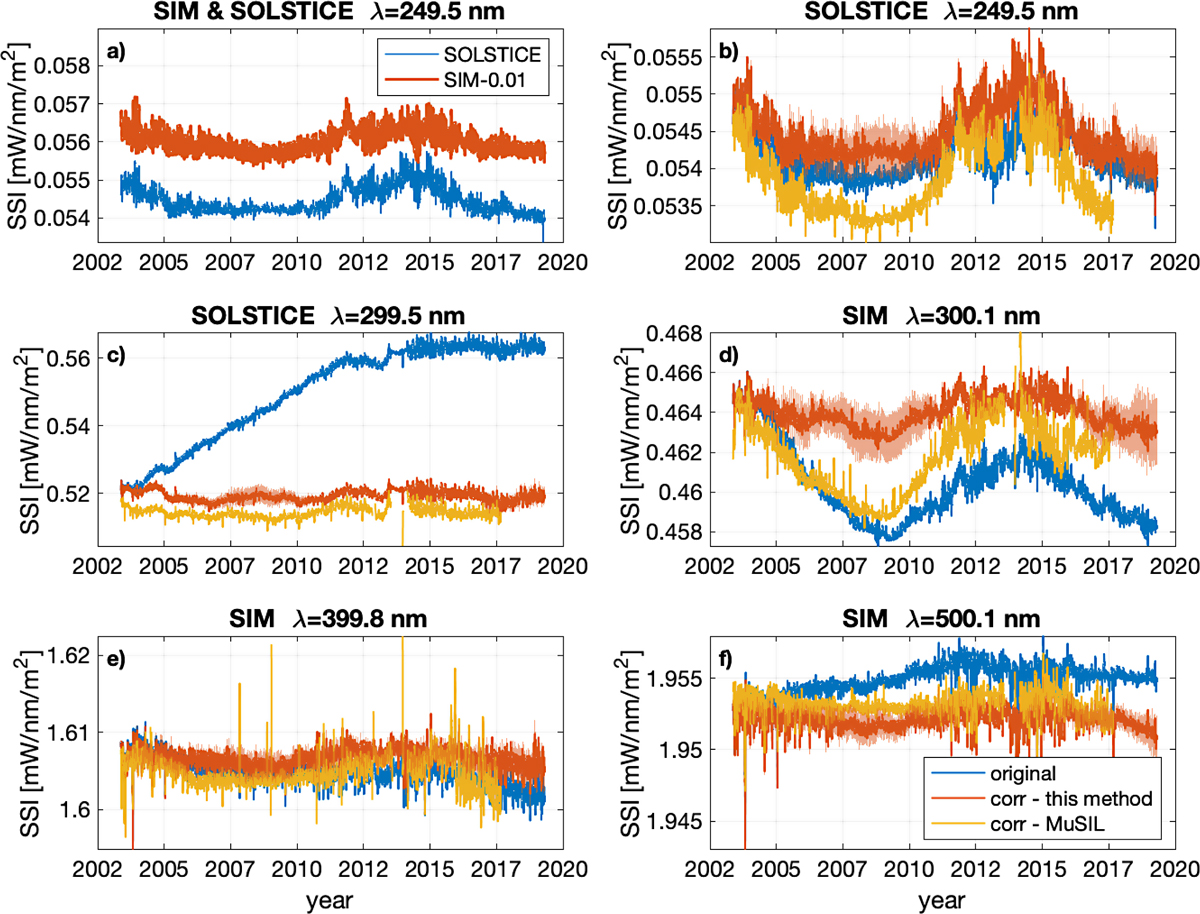
Comparison of different SSI reconstructions. Plot (a) compares our reconstruction from SORCE/SOLSTICE and SORCE/SIM at the wavelength nearest to 249.5 nm. For easier comparison, the record from SORCE/SIM has been shifted downwards by 0.01 mW/nm/m2. Plots (b–f) compare reconstructions based on our method and on MuSIL only. In each plot we use a 9th order model and consider the median correction of all six proxies. The reconstruction, according to MuSIL (available from https://lasp.colorado.edu/lisird/), is based on an earlier release of SORCE data and therefore is not strictly comparable to our reconstruction. Short dropouts observed at 500.1 nm are primarily due to sunspot darkening. The shaded area around our reconstruction represents a ±2σ confidence interval that has been estimated by bootstrapping.
Current usage metrics show cumulative count of Article Views (full-text article views including HTML views, PDF and ePub downloads, according to the available data) and Abstracts Views on Vision4Press platform.
Data correspond to usage on the plateform after 2015. The current usage metrics is available 48-96 hours after online publication and is updated daily on week days.
Initial download of the metrics may take a while.


