Open Access
Fig. 4
Download original image
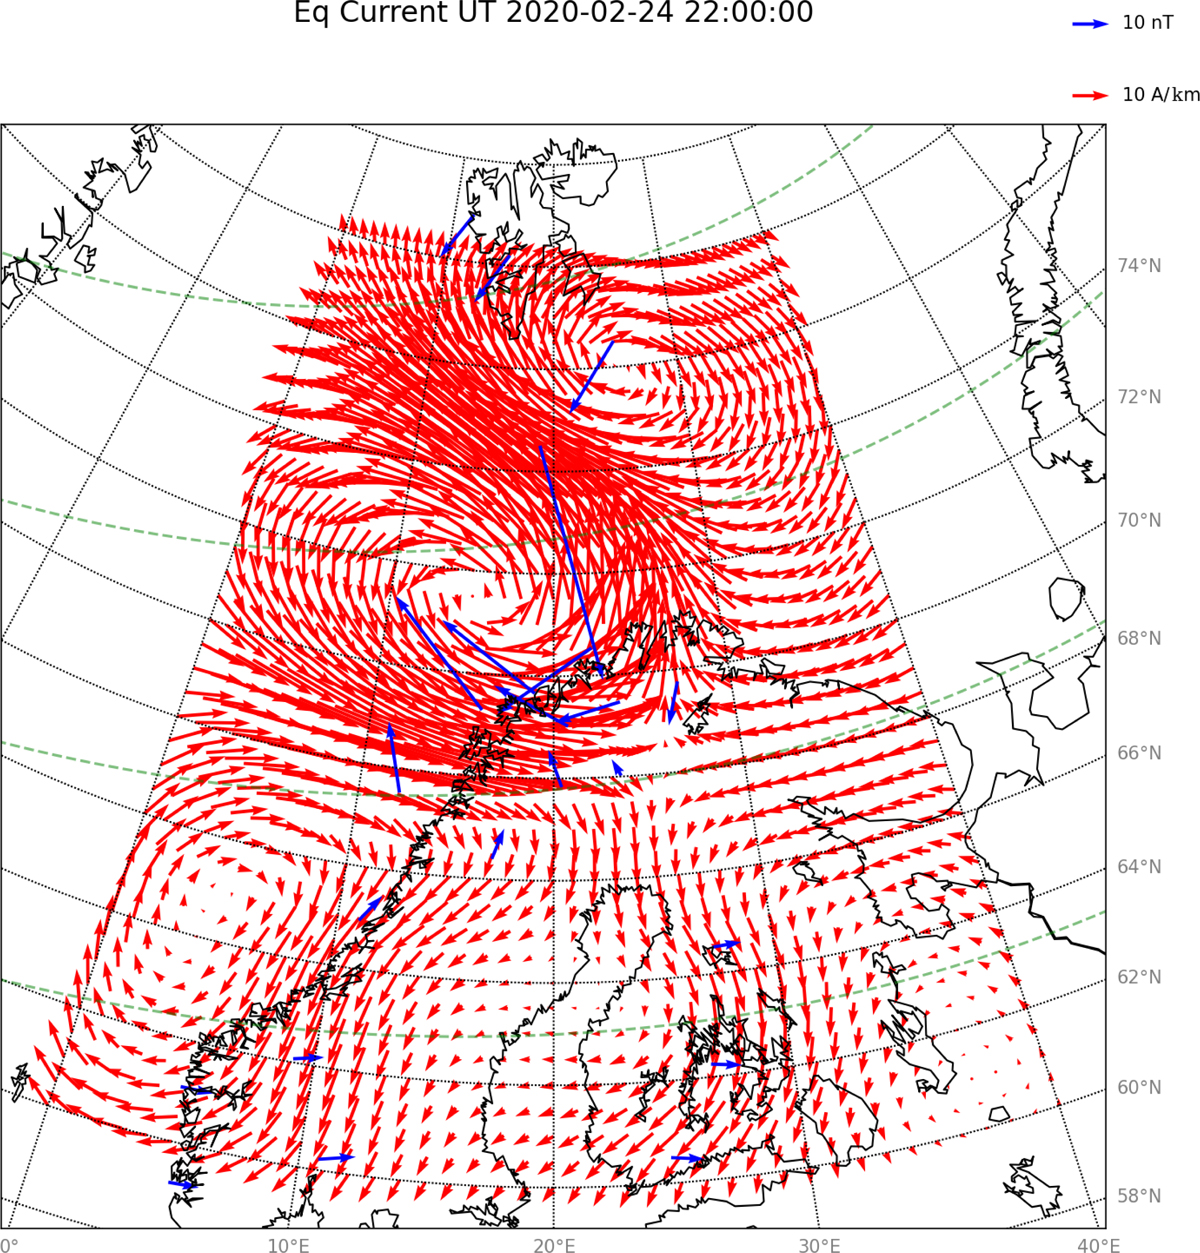
Map showing estimated equivalent currents (red arrows) above northern Fennoscandia on February 24. 21.23 UT / 22.23 LT. Accompanying magnetic field disturbances measured at the IMAGE magnetometer stations and used as input to the SECS method are indicated with blue arrows.
Current usage metrics show cumulative count of Article Views (full-text article views including HTML views, PDF and ePub downloads, according to the available data) and Abstracts Views on Vision4Press platform.
Data correspond to usage on the plateform after 2015. The current usage metrics is available 48-96 hours after online publication and is updated daily on week days.
Initial download of the metrics may take a while.