Fig. 1
Download original image
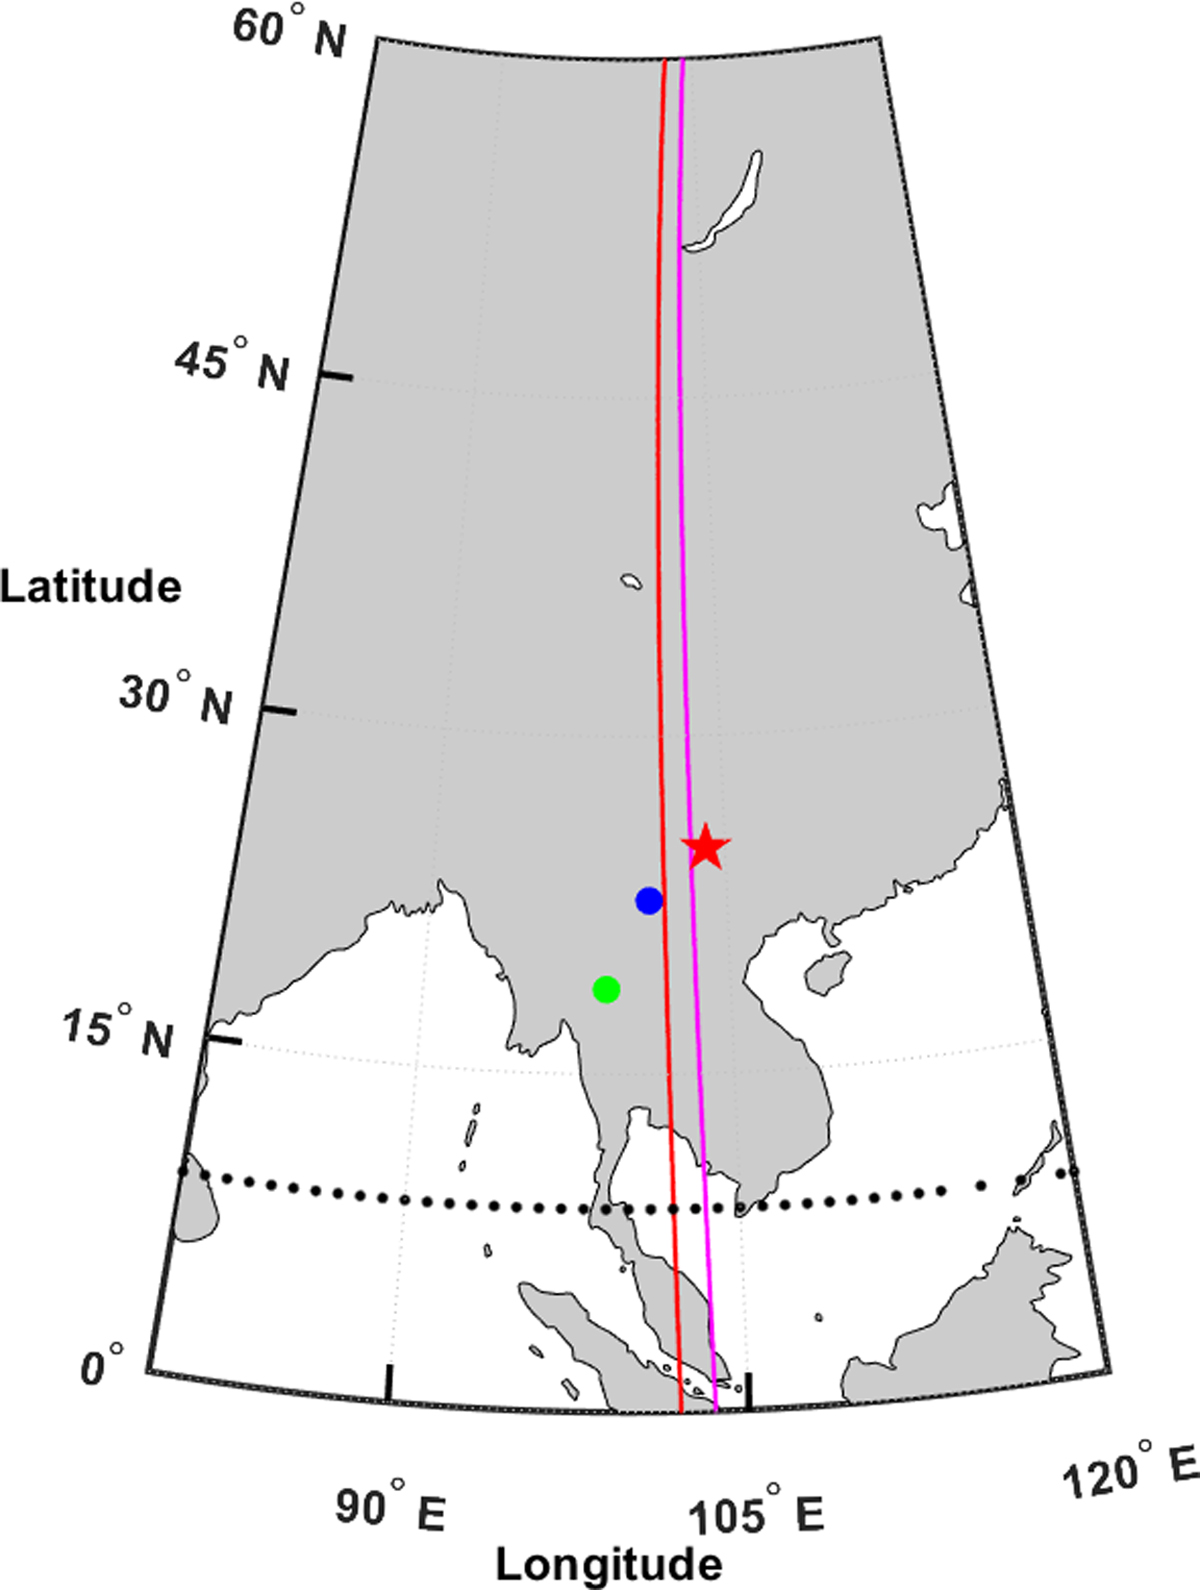
Geophysical distribution of the pair of ionosondes (blue and green dots represent PUR and CMU, respectively), all-sky imager (red star), and the trace of the pair of Swarm A (the red solid line) and C (the magenta solid line) from ~13:03 UT to ~13:19 UT on 13 March 2015. The dotted backline represents the dip equator.
Current usage metrics show cumulative count of Article Views (full-text article views including HTML views, PDF and ePub downloads, according to the available data) and Abstracts Views on Vision4Press platform.
Data correspond to usage on the plateform after 2015. The current usage metrics is available 48-96 hours after online publication and is updated daily on week days.
Initial download of the metrics may take a while.