Open Access
Fig. 5
Download original image
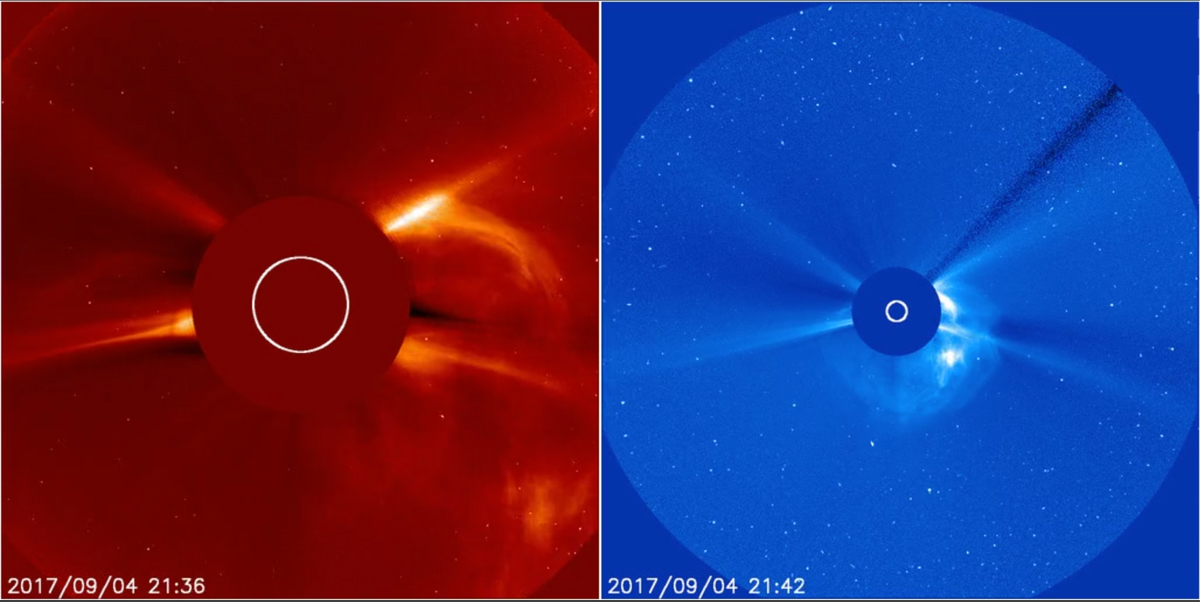
A snapshot of the SOHO c2 (left) and c3 (right) coronagraph video showing the launch of an Earth-directed CME into interplanetary space during the first forecast interval. As with Figure 3, each frame contains images taken within 20 min of each other.
Current usage metrics show cumulative count of Article Views (full-text article views including HTML views, PDF and ePub downloads, according to the available data) and Abstracts Views on Vision4Press platform.
Data correspond to usage on the plateform after 2015. The current usage metrics is available 48-96 hours after online publication and is updated daily on week days.
Initial download of the metrics may take a while.