Open Access
Fig. 6
Download original image
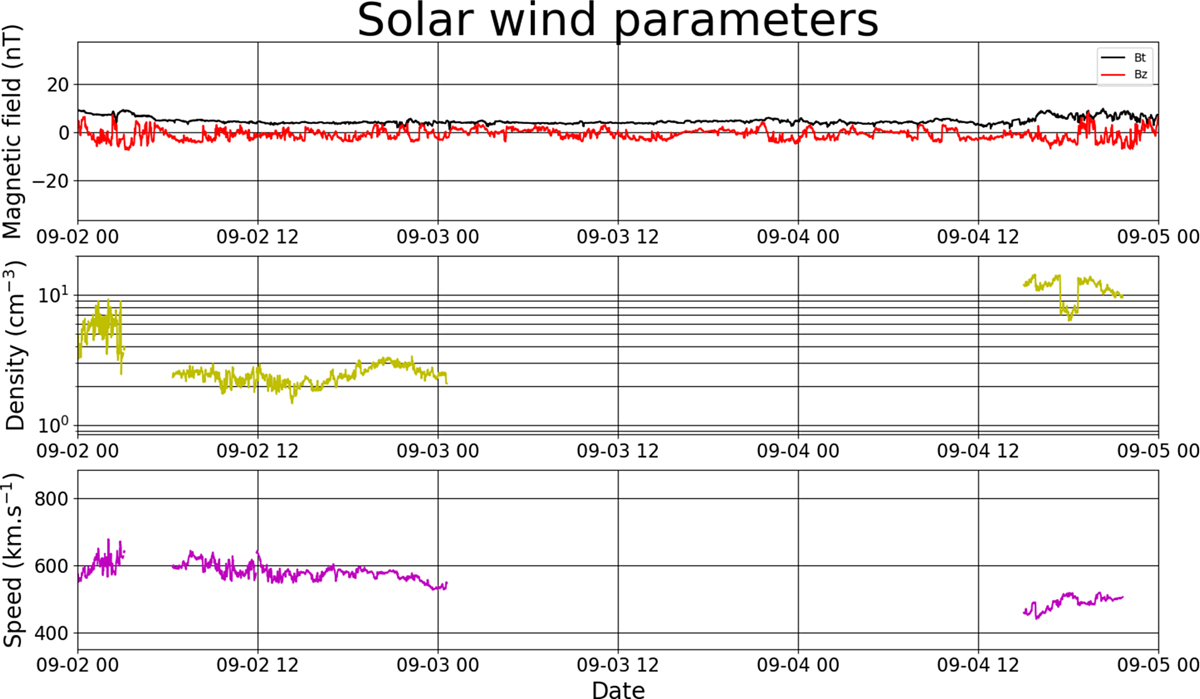
Solar wind in situ data collected during the first forecast interval. The top panel shows the IMF strength (Bt, black) and the IMF Bz (red) component. The middle panel shows the solar wind proton density. The bottom panel shows the solar wind speed.
Current usage metrics show cumulative count of Article Views (full-text article views including HTML views, PDF and ePub downloads, according to the available data) and Abstracts Views on Vision4Press platform.
Data correspond to usage on the plateform after 2015. The current usage metrics is available 48-96 hours after online publication and is updated daily on week days.
Initial download of the metrics may take a while.