Fig. 3
Download original image
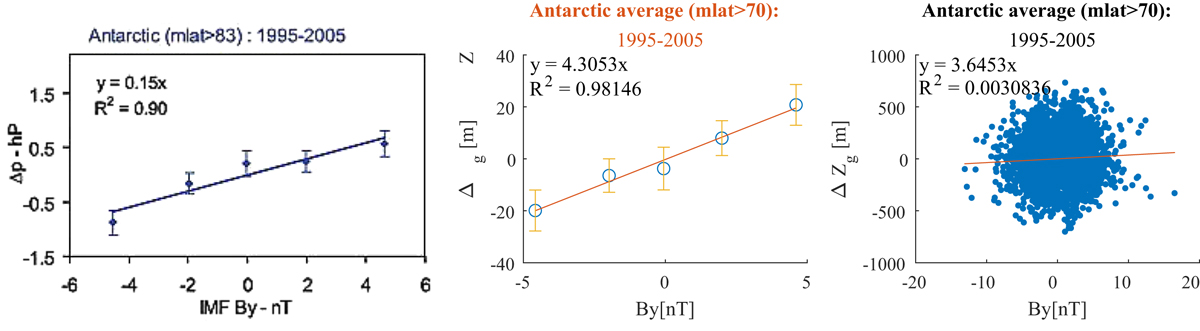
Left panel: A copy of the upper panel of Figure 1 in B2008. It represents linear regression of Δp after the original measurement from three Antarctic stations at mlat >83° S was grouped according to the IMF By. Middle panel: Reproduction of the linear regression method using ΔZg at ~mlat >70° S. Error bars are plus/minus one standard-error-in-the-mean. Right panel: Scatter plot and linear regression for the ΔZg data without the initial five-bin grouping. The upper panel of Figure 1 in B2008 is reproduced with permission from John Wiley and Sons.
Current usage metrics show cumulative count of Article Views (full-text article views including HTML views, PDF and ePub downloads, according to the available data) and Abstracts Views on Vision4Press platform.
Data correspond to usage on the plateform after 2015. The current usage metrics is available 48-96 hours after online publication and is updated daily on week days.
Initial download of the metrics may take a while.