Fig. 4
Download original image
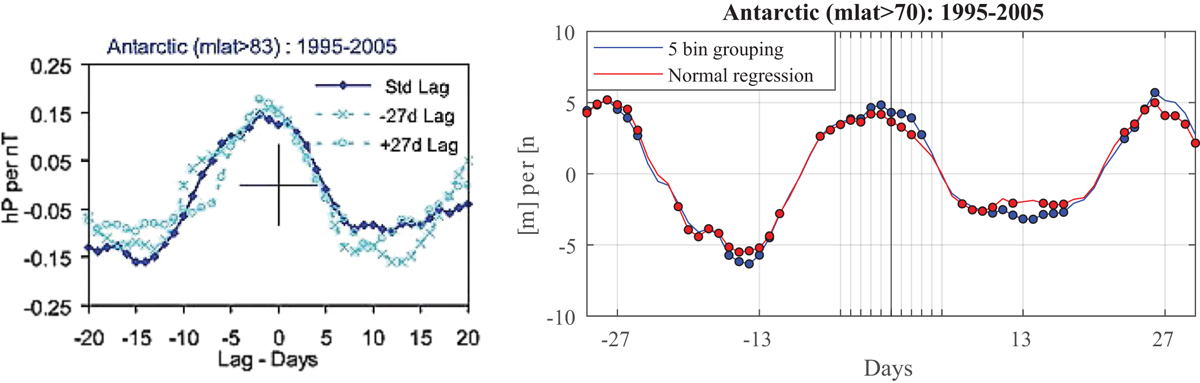
Left panel: A copy of the upper panel of Figure 2 in B2008. The figure illustrates calculated regression coefficients showing lead–lag variations of Δp at mlat >83° S. It shows three cycles of IMF By, where the dark blue line represents the regression coefficients without any lag, while x and o cyan lines represent a −27 and +27 day lag between IMF By and Δp data series. All maxima in Δp are seen to occur −2 days before the peak in the IMF driver, which occurs at day 0. Right panel: Lead–lag variations of ΔZg at mlat >70° S. The blue line is the calculated regression coefficients showing lead–lags when the five bin method by B2008 is used. The red line is the regression coefficients showing lead–lag variations when regression is done without the initial grouping. Negative days (leads) represent ΔZg occurring before the By component, and positive days By occurring before ΔZg. Dots indicate significance at the 95% level for the regression coefficients calculated by Student’s t-test. The upper panel of Figure 2 in B2008 is reproduced with permission from John Wiley and Sons.
Current usage metrics show cumulative count of Article Views (full-text article views including HTML views, PDF and ePub downloads, according to the available data) and Abstracts Views on Vision4Press platform.
Data correspond to usage on the plateform after 2015. The current usage metrics is available 48-96 hours after online publication and is updated daily on week days.
Initial download of the metrics may take a while.