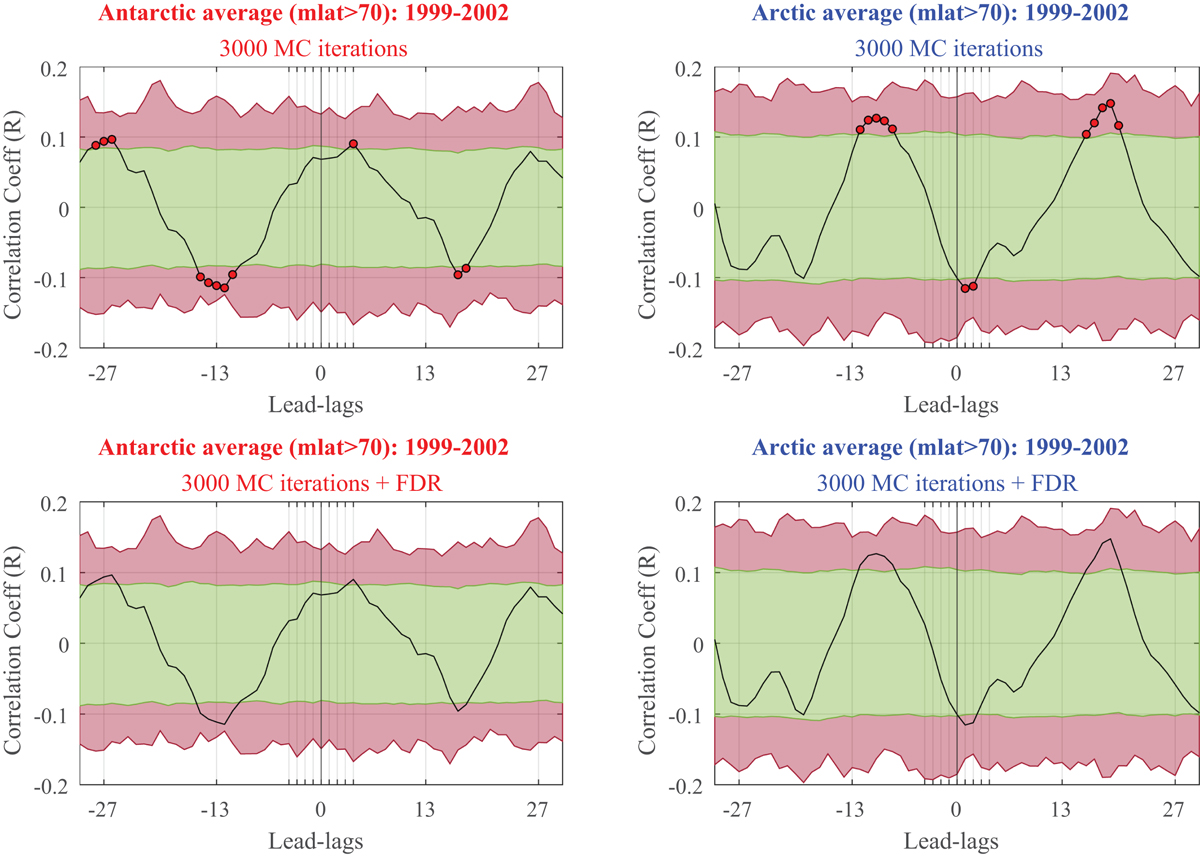
Fig. 6
Download original image
Left panels: The significance level for the lead–lag correlation coefficients after 3000 MC-iterations for the period 1999–2002 in the SH. Dark red circles indicate 95% significance of the individual hypothesis tests (top panel). No significance is obtained after FDR. This is the case whether FDR is computed for the interval −27 to +27 (N = 55), −13 to +13 (N = 27) or +2 to +6 (N = 5) lead–lags (bottom panel). Right panels: Same procedure, only for the NH (top panel). No significance is obtained after FDR. This is the case whether FDR is computed for the interval −27 to +27 (N = 55), −13 to +13 (N = 27) or −2 to +2 (N = 5) lead–lags (bottom panel).
Current usage metrics show cumulative count of Article Views (full-text article views including HTML views, PDF and ePub downloads, according to the available data) and Abstracts Views on Vision4Press platform.
Data correspond to usage on the plateform after 2015. The current usage metrics is available 48-96 hours after online publication and is updated daily on week days.
Initial download of the metrics may take a while.