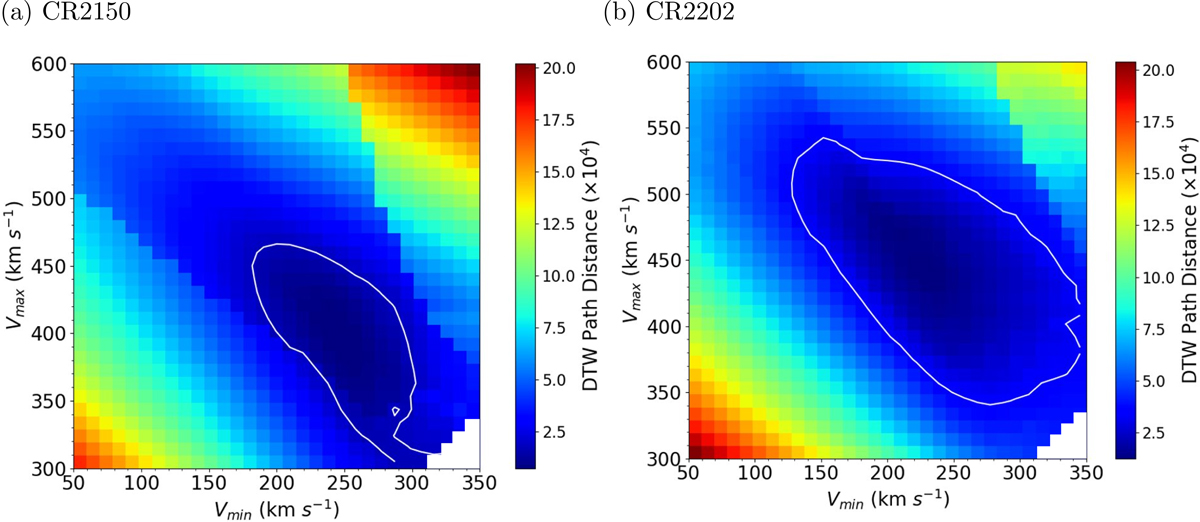
Fig. 12

Download original image
Contour plots of the DTW path distance as a function of minimum and maximum inner boundary velocity for Carrington rotations (a) 2150 and (b) 2202. The white contour bounds the area that yields a DTW path distance under the threshold chosen (SSF ≤ 0.95), and the white pixels in the lower right corner represent invalid model parameters where Vmin > Vmax. Note that the Vmax range is altered to 300–600 km s−1 in this plot.
Current usage metrics show cumulative count of Article Views (full-text article views including HTML views, PDF and ePub downloads, according to the available data) and Abstracts Views on Vision4Press platform.
Data correspond to usage on the plateform after 2015. The current usage metrics is available 48-96 hours after online publication and is updated daily on week days.
Initial download of the metrics may take a while.


