Figure 10
Download original image
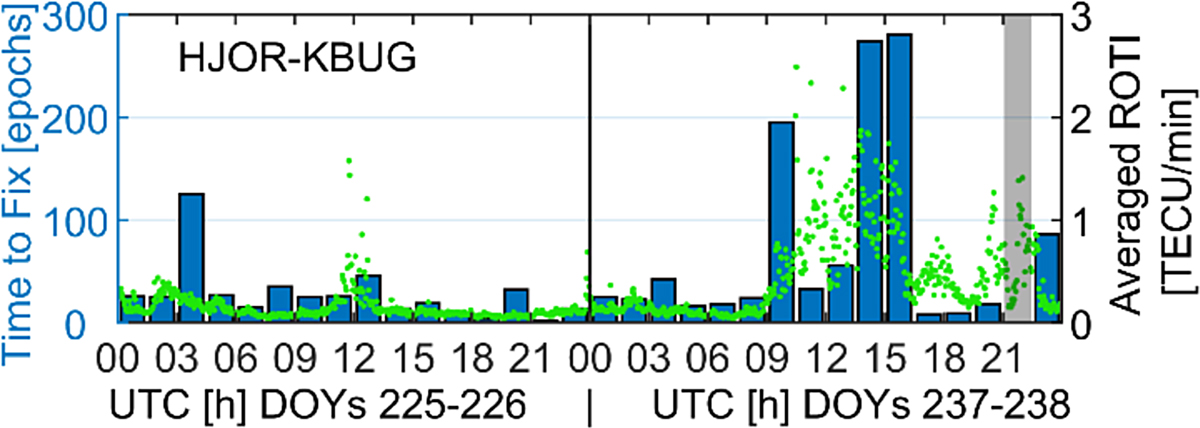
TTF for RTK positioning of HJOR-KBUG baseline during the disturbed conditions in the period of August 25–26, 2018, and two undisturbed days before the event. A grey bar corresponds to the session during which we did not achieve a correct ambiguity fixing within a time limit of 3 h. The ROTI values for the KBUG station given in green are averaged over all satellites.
Current usage metrics show cumulative count of Article Views (full-text article views including HTML views, PDF and ePub downloads, according to the available data) and Abstracts Views on Vision4Press platform.
Data correspond to usage on the plateform after 2015. The current usage metrics is available 48-96 hours after online publication and is updated daily on week days.
Initial download of the metrics may take a while.