Figure 12
Download original image
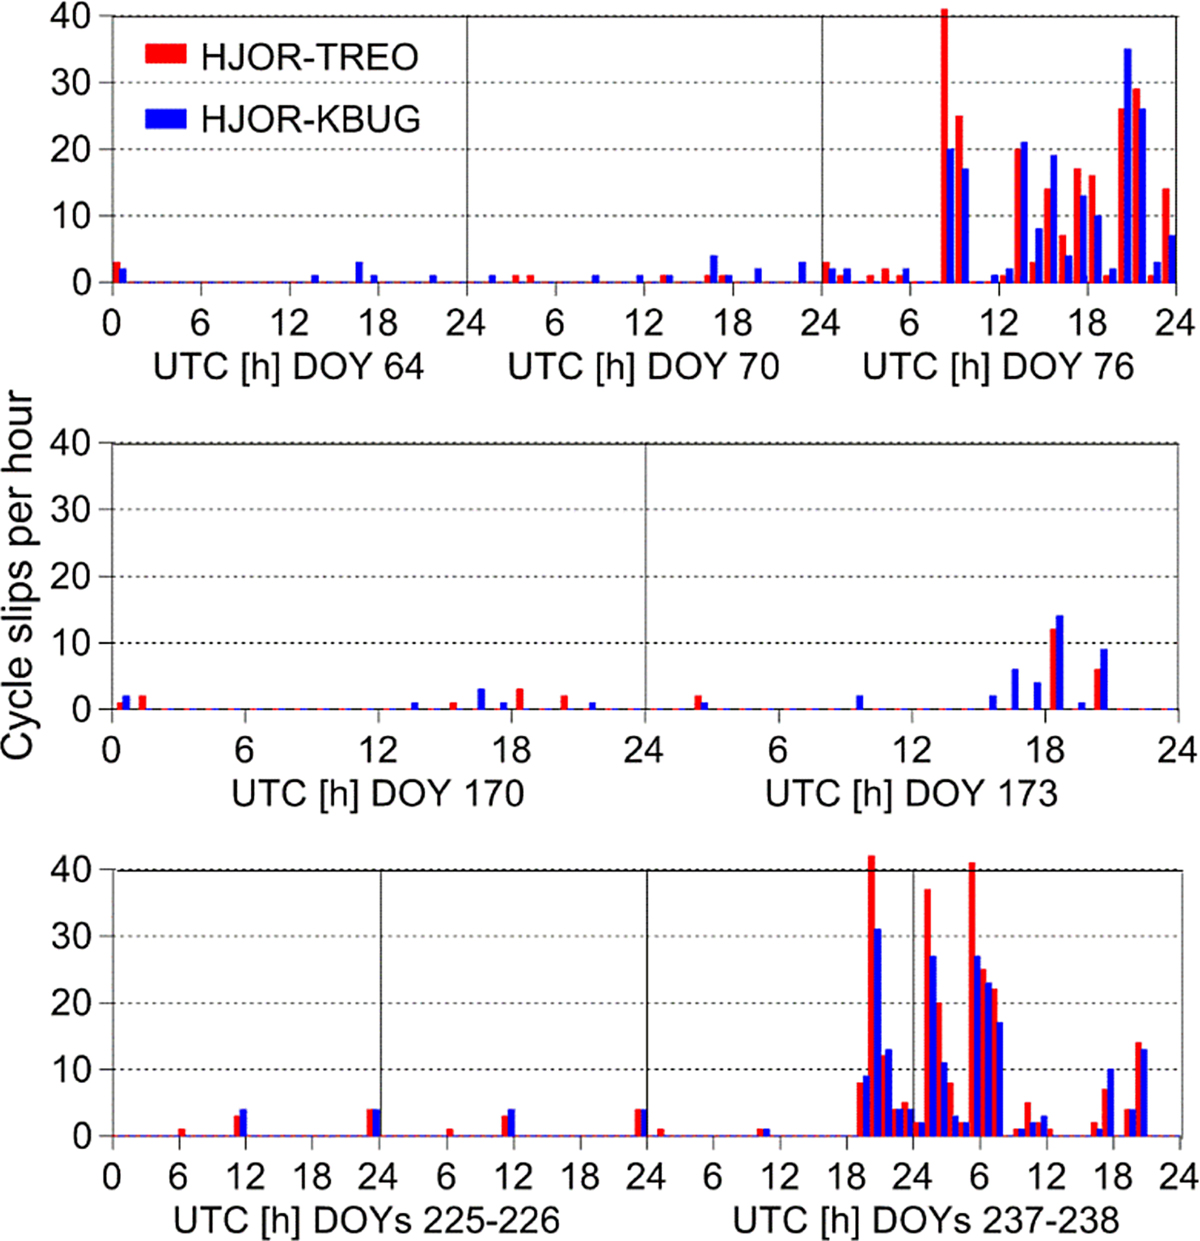
The total number of L1&L2 cycle slips per hour for HJOR-TREO and HJOR-KBUG baselines during the St. Patrick’s Day storm on March 17, 2015 (top panel), the storm of June 22, 2015 (center panel), the disturbed conditions in the period of August 25–26, 2018 (bottom panel), and for the undisturbed days preceding the events.
Current usage metrics show cumulative count of Article Views (full-text article views including HTML views, PDF and ePub downloads, according to the available data) and Abstracts Views on Vision4Press platform.
Data correspond to usage on the plateform after 2015. The current usage metrics is available 48-96 hours after online publication and is updated daily on week days.
Initial download of the metrics may take a while.