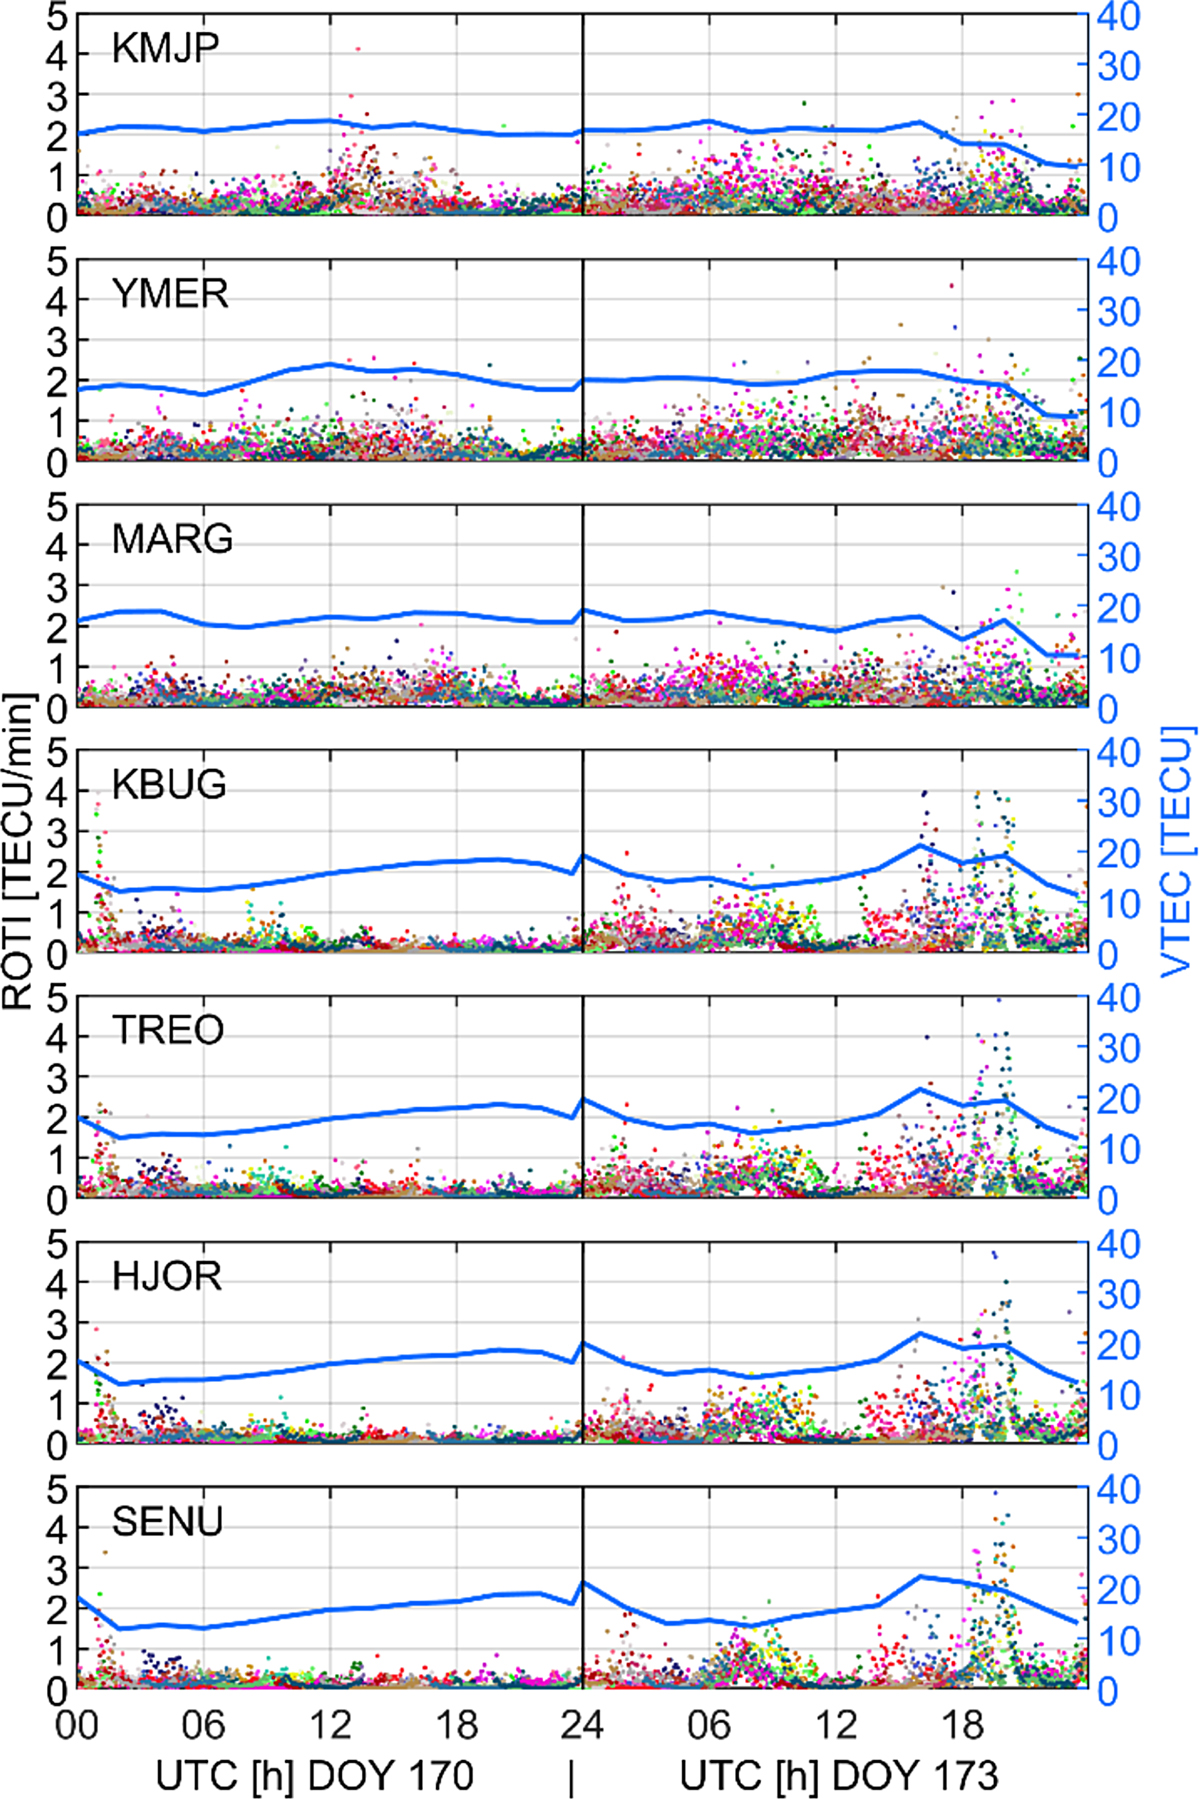
Figure 4
Download original image
ROTI and VTEC time series at selected GNSS stations during the storm of June 22, 2015 (DOY 170) and for the undisturbed day (June 19, 2015, DOY 173). Colors distinguish the values for different GPS satellites.
Current usage metrics show cumulative count of Article Views (full-text article views including HTML views, PDF and ePub downloads, according to the available data) and Abstracts Views on Vision4Press platform.
Data correspond to usage on the plateform after 2015. The current usage metrics is available 48-96 hours after online publication and is updated daily on week days.
Initial download of the metrics may take a while.