Figure 5
Download original image
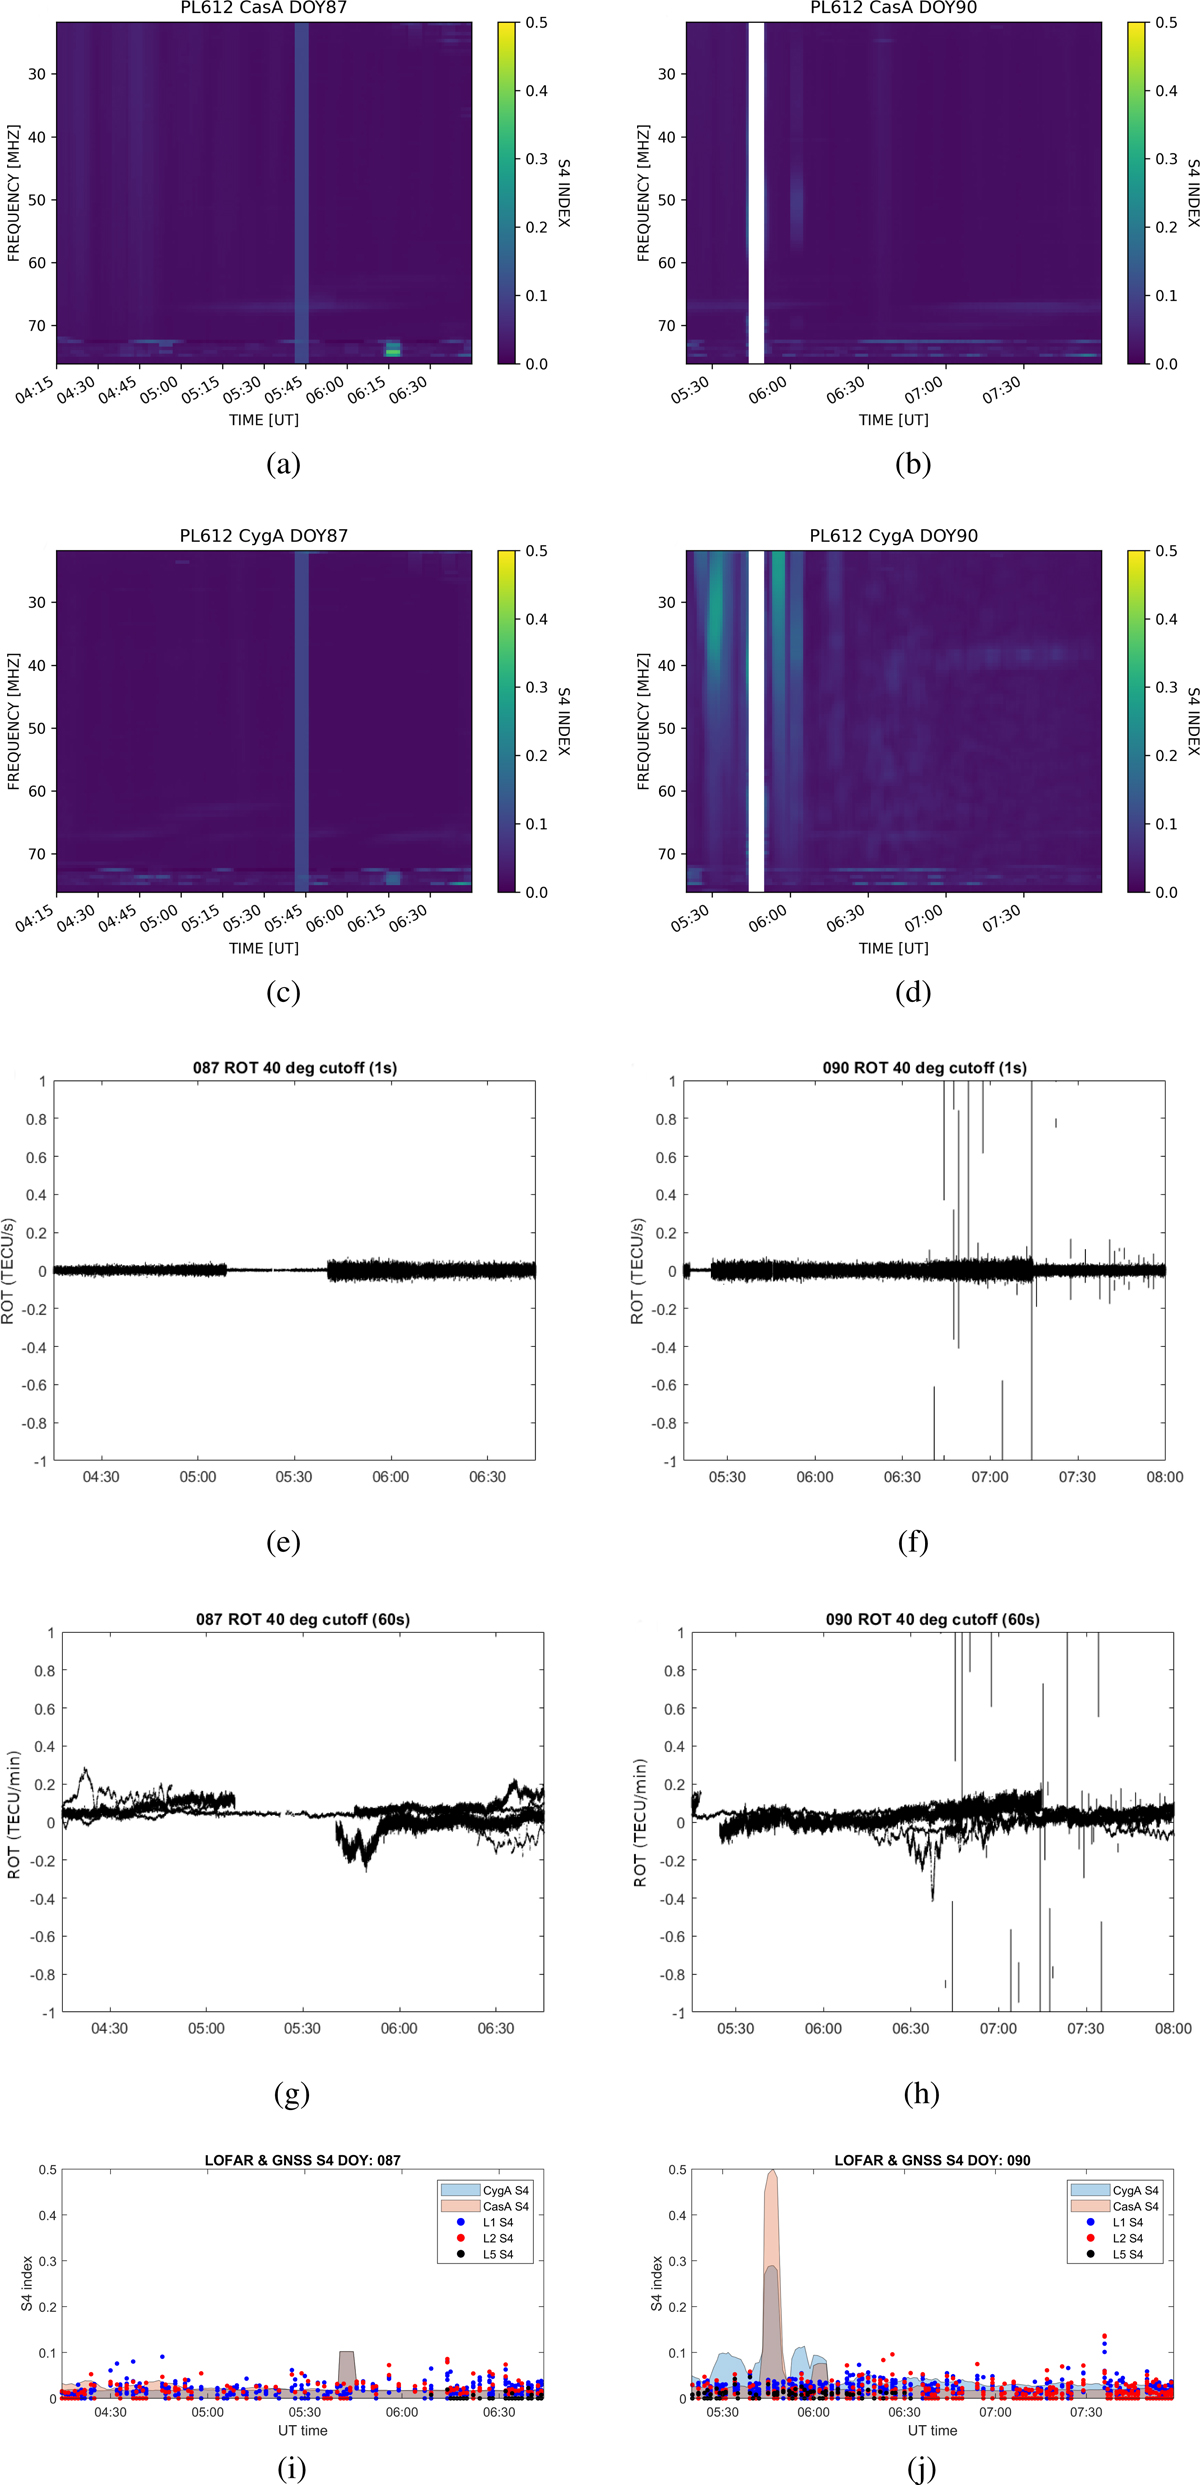
LOFAR S4 of Cassiopeia A (a, b) and Cygnus A (c, d) calculated for days 87 (quiet) and 90 (disturbed) in 2017, recorded on LOFAR station PL612. GNSS ROT values were calculated for 1 s (e, f) and 60 s (g, h) for days 87 and 90 of 2017. GNSS S4 index (i, j) observed on L1 (blue dots), L2 (red dots) and L5 black dots) frequencies recorded with the ionospheric monitor co-located with the PL612; LOFAR scintillation indices for the 48.92 MHz channel (from Figs. 4a to 4d) are also shown as pink area (Cas A) and blue area (Cyg A). Gaps in the GNSS scintillation indices were due to issues related to data downloading.
Current usage metrics show cumulative count of Article Views (full-text article views including HTML views, PDF and ePub downloads, according to the available data) and Abstracts Views on Vision4Press platform.
Data correspond to usage on the plateform after 2015. The current usage metrics is available 48-96 hours after online publication and is updated daily on week days.
Initial download of the metrics may take a while.