Figure 6
Download original image
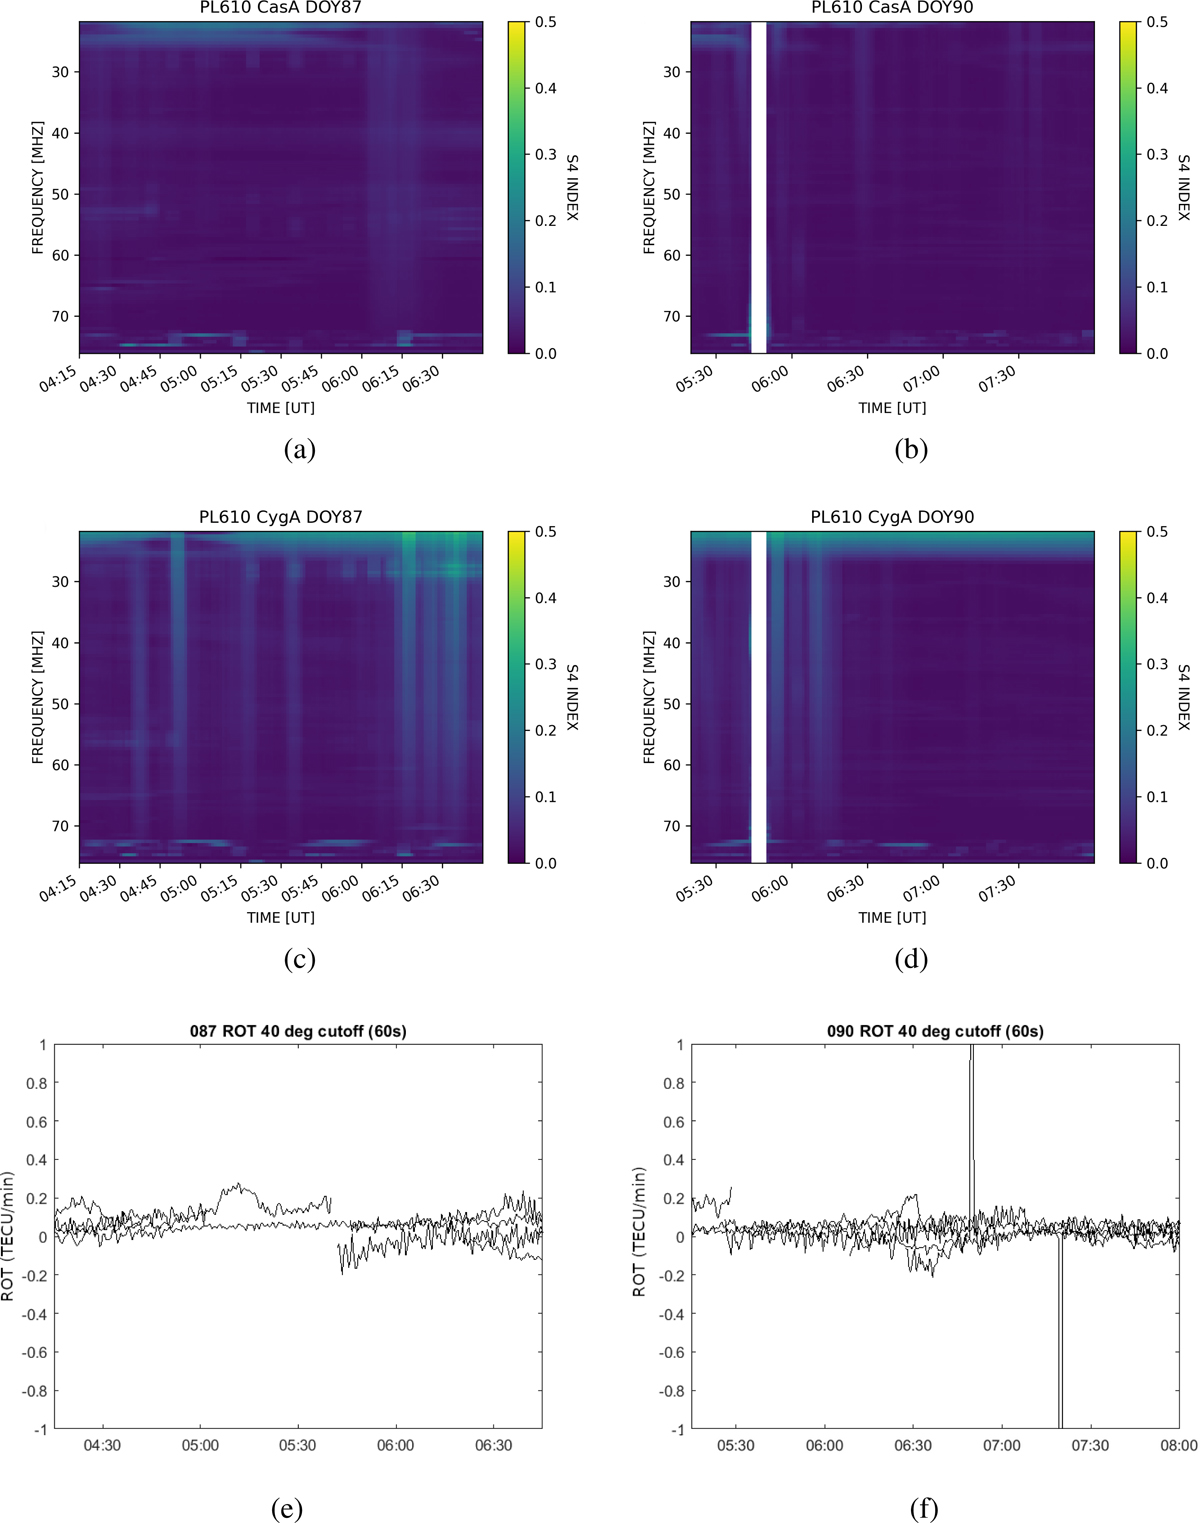
LOFAR S4 of CasA (a, b) and CygA (c, d) calculated for days 87 and 90 of 2017, recorded on LOFAR station PL610. ROT values (e, f) calculated for 60 s for days 87 and 90 of 2017 from observations recorded by receiver near PL610 station.
Current usage metrics show cumulative count of Article Views (full-text article views including HTML views, PDF and ePub downloads, according to the available data) and Abstracts Views on Vision4Press platform.
Data correspond to usage on the plateform after 2015. The current usage metrics is available 48-96 hours after online publication and is updated daily on week days.
Initial download of the metrics may take a while.