Figure 4
Download original image
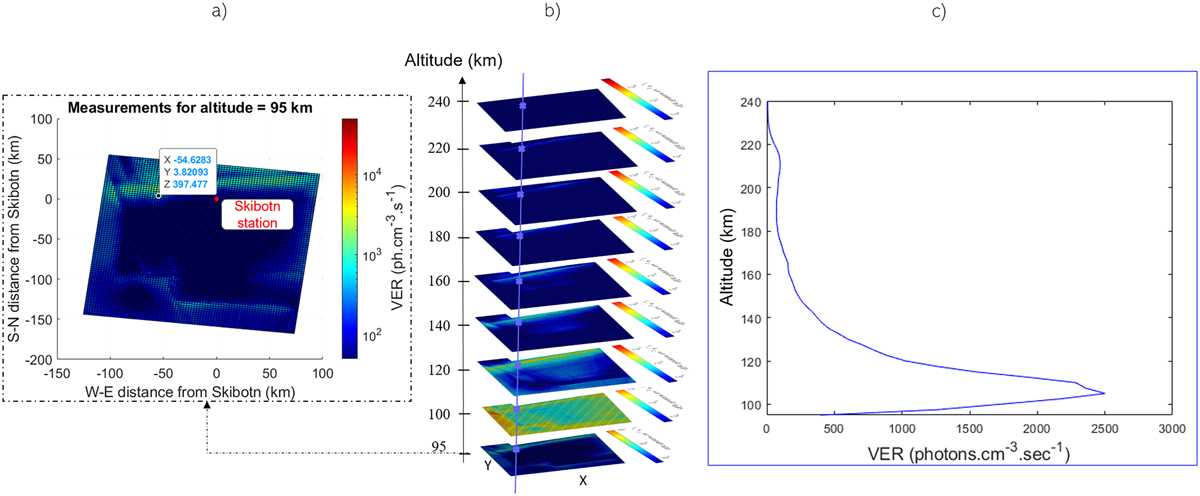
Visualization of VER on March 5th, 2008, at 18:42:40 UT (70 seconds later than dataset 1) for the ![]() 1NG line at 427.8 nm. (a) 2D projection at 95 km altitude centred on Skibotn corresponding to X = 0 km and Y = 0 km location (see the red point), (b) 3D mapping from 95 km to 240 km altitude, (c) VER field-aligned profile at different altitudes for a given location in the map (here X = −54.6 km and Y = 3.8 km at 95 km altitude).
1NG line at 427.8 nm. (a) 2D projection at 95 km altitude centred on Skibotn corresponding to X = 0 km and Y = 0 km location (see the red point), (b) 3D mapping from 95 km to 240 km altitude, (c) VER field-aligned profile at different altitudes for a given location in the map (here X = −54.6 km and Y = 3.8 km at 95 km altitude).
Current usage metrics show cumulative count of Article Views (full-text article views including HTML views, PDF and ePub downloads, according to the available data) and Abstracts Views on Vision4Press platform.
Data correspond to usage on the plateform after 2015. The current usage metrics is available 48-96 hours after online publication and is updated daily on week days.
Initial download of the metrics may take a while.