Figure 4
Download original image
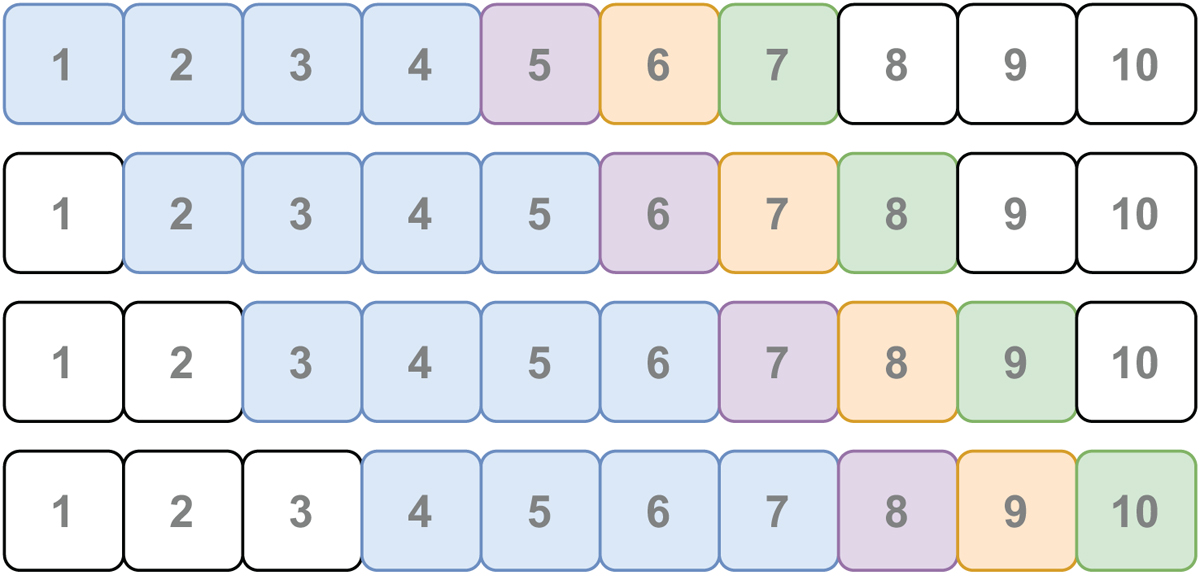
Illustration of the sliding window technique for a sample of 10 timesteps, where each number denotes a distinct time step. As an example here, the input horizon (blue color) length is 4 timesteps and the output horizon length is three timesteps. The input window slides one time step at a time across the entire data sequence to generate four distinct input and forecast horizon pairs. The purple, orange, and green colors of the output horizon represent 1-day, 2-day, and 3-day ahead forecasting, respectively. The timesteps of 1-day ahead forecasting across the data sequences are then concatenated into a single timeseries list that is called 1-day ahead prediction. The same for 2-day and 3-day ahead.
Current usage metrics show cumulative count of Article Views (full-text article views including HTML views, PDF and ePub downloads, according to the available data) and Abstracts Views on Vision4Press platform.
Data correspond to usage on the plateform after 2015. The current usage metrics is available 48-96 hours after online publication and is updated daily on week days.
Initial download of the metrics may take a while.