Figure 4
Download original image
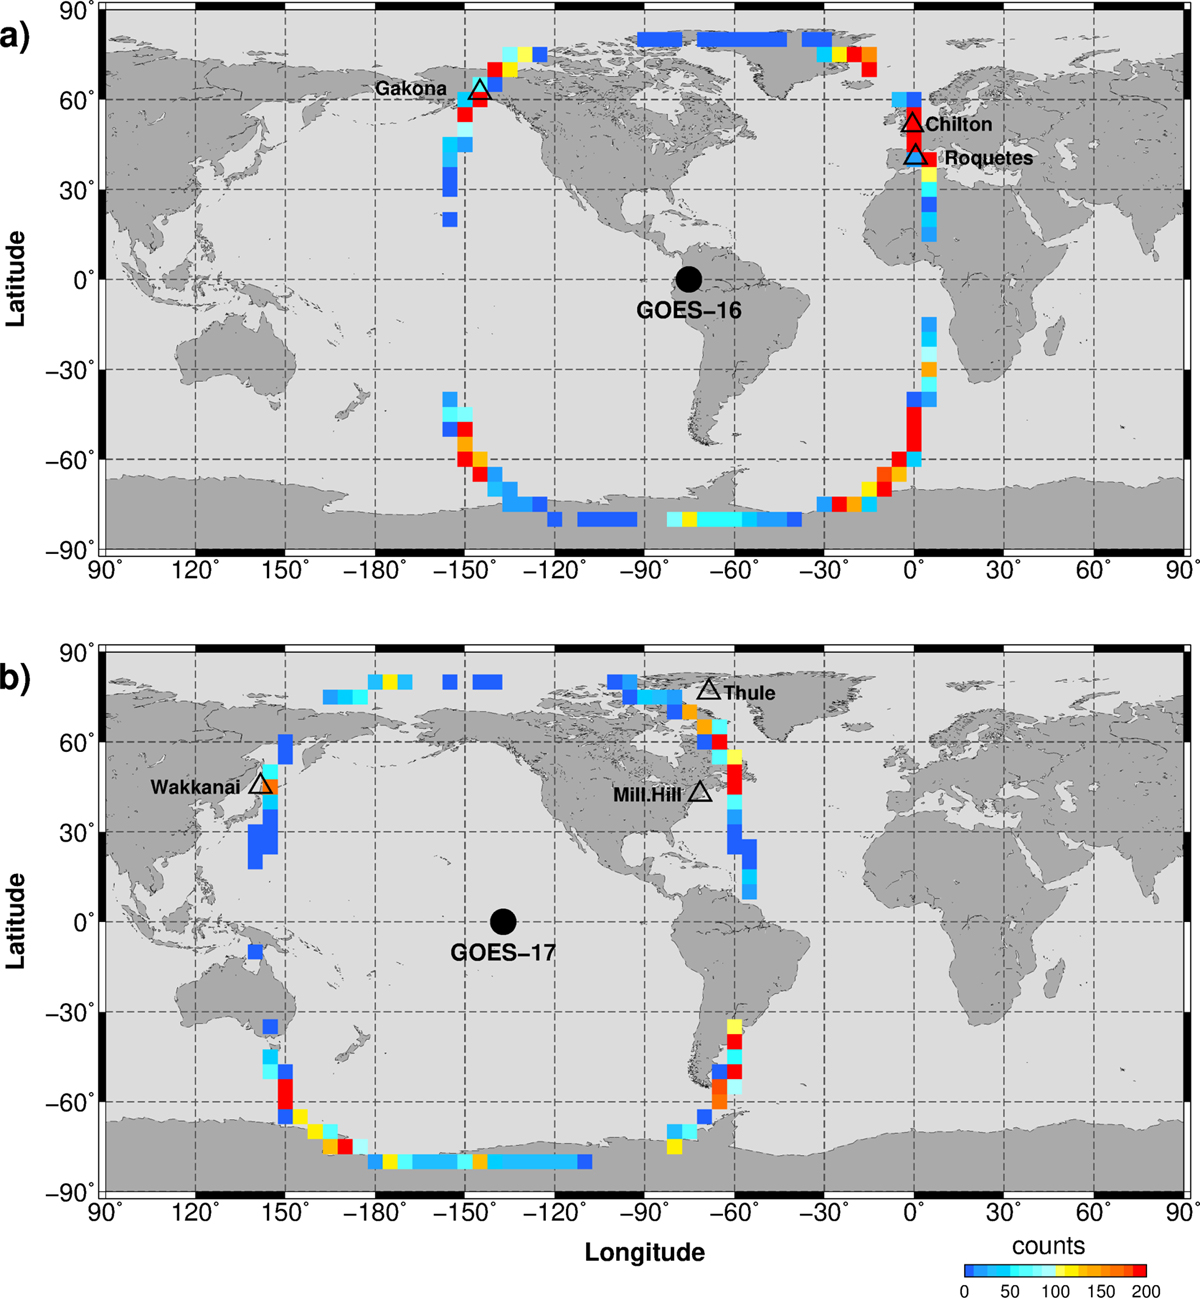
Geographic distribution of RO EDPs at the F2 peak coordinates for (a) GOES-16 in 2018–2021 and (b) GOES-17 satellites in 2019–2021; profiles accumulation per 5° × 5° latitude/longitude bins is shown by color. Black circles show a projection of the GOES satellites and black triangles show locations of several ground-based ionosondes.
Current usage metrics show cumulative count of Article Views (full-text article views including HTML views, PDF and ePub downloads, according to the available data) and Abstracts Views on Vision4Press platform.
Data correspond to usage on the plateform after 2015. The current usage metrics is available 48-96 hours after online publication and is updated daily on week days.
Initial download of the metrics may take a while.