Figure 3
Download original image
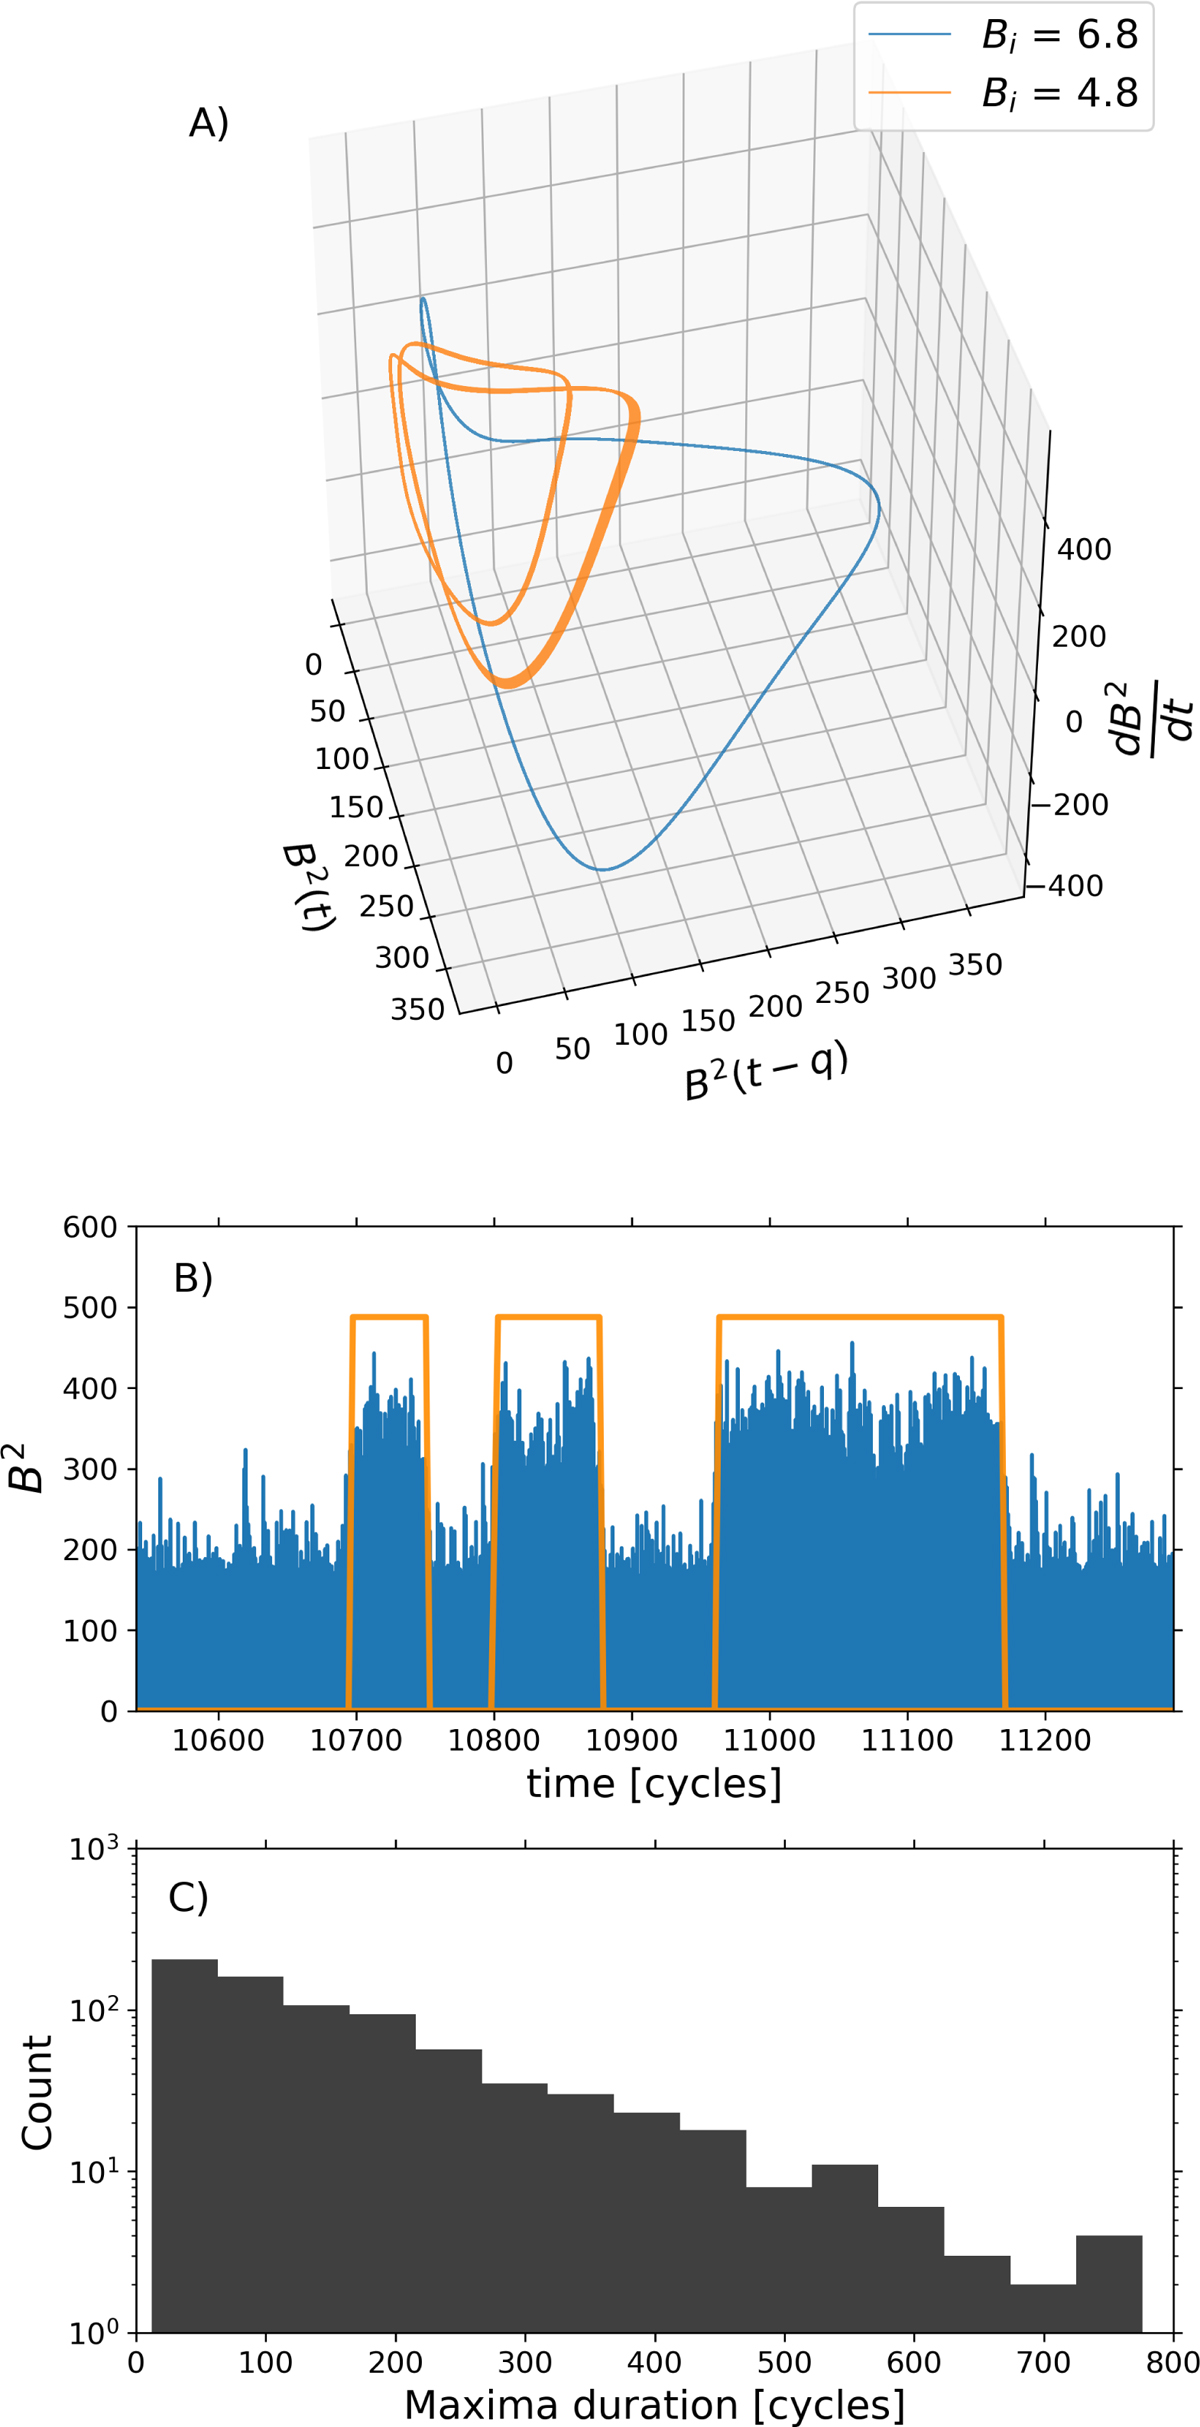
(A) Phase space trajectories for two 0D dynamo solutions with N/Ncrit = 2.99 (see red line segment on Fig. 2C). The two solutions differ only in their initial condition, each located in a distinct basin of attraction. (B) A representative time series of the same dynamo solution, now with additive stochastic noise introduced on the RHS of equation (8). The orange lines are added to delineate the low and high amplitude epochs. (C) Probability density function for the duration of sustained high amplitude epochs, as extracted from panel B.
Current usage metrics show cumulative count of Article Views (full-text article views including HTML views, PDF and ePub downloads, according to the available data) and Abstracts Views on Vision4Press platform.
Data correspond to usage on the plateform after 2015. The current usage metrics is available 48-96 hours after online publication and is updated daily on week days.
Initial download of the metrics may take a while.