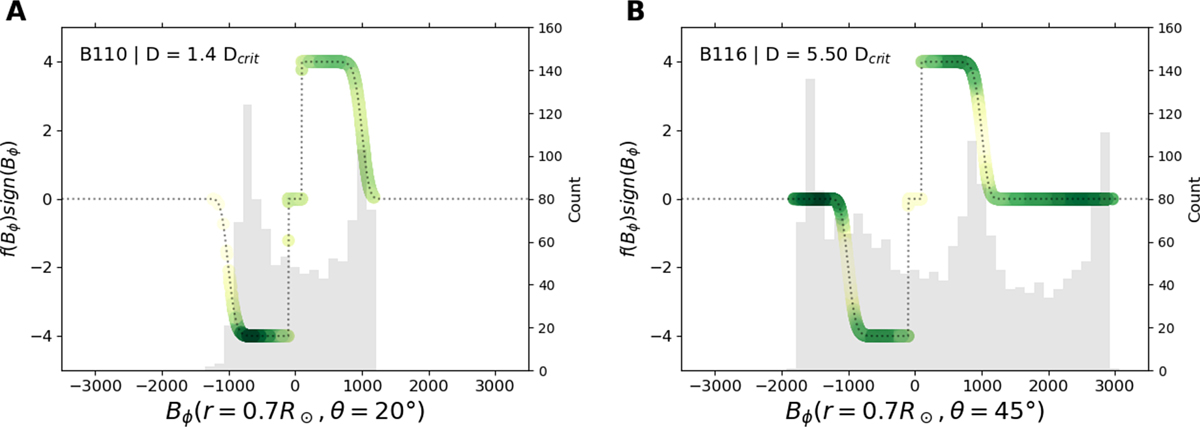
Figure 7

Download original image
Sampling of the Babcock-Leighton nonlinearity f(B) for the two time-latitude diagrams of Figures 6A and 6B, along temporal cuts at latitudes 25° and 45°, respectively. The histograms display the sampling of toroidal field values along the cuts, and the color shading indicates the fraction of time spent at a given point along the non-linearity curve (dotted line). Note the marked magnetic polarity asymmetry in panel B.
Current usage metrics show cumulative count of Article Views (full-text article views including HTML views, PDF and ePub downloads, according to the available data) and Abstracts Views on Vision4Press platform.
Data correspond to usage on the plateform after 2015. The current usage metrics is available 48-96 hours after online publication and is updated daily on week days.
Initial download of the metrics may take a while.


