Figure 3

Download original image
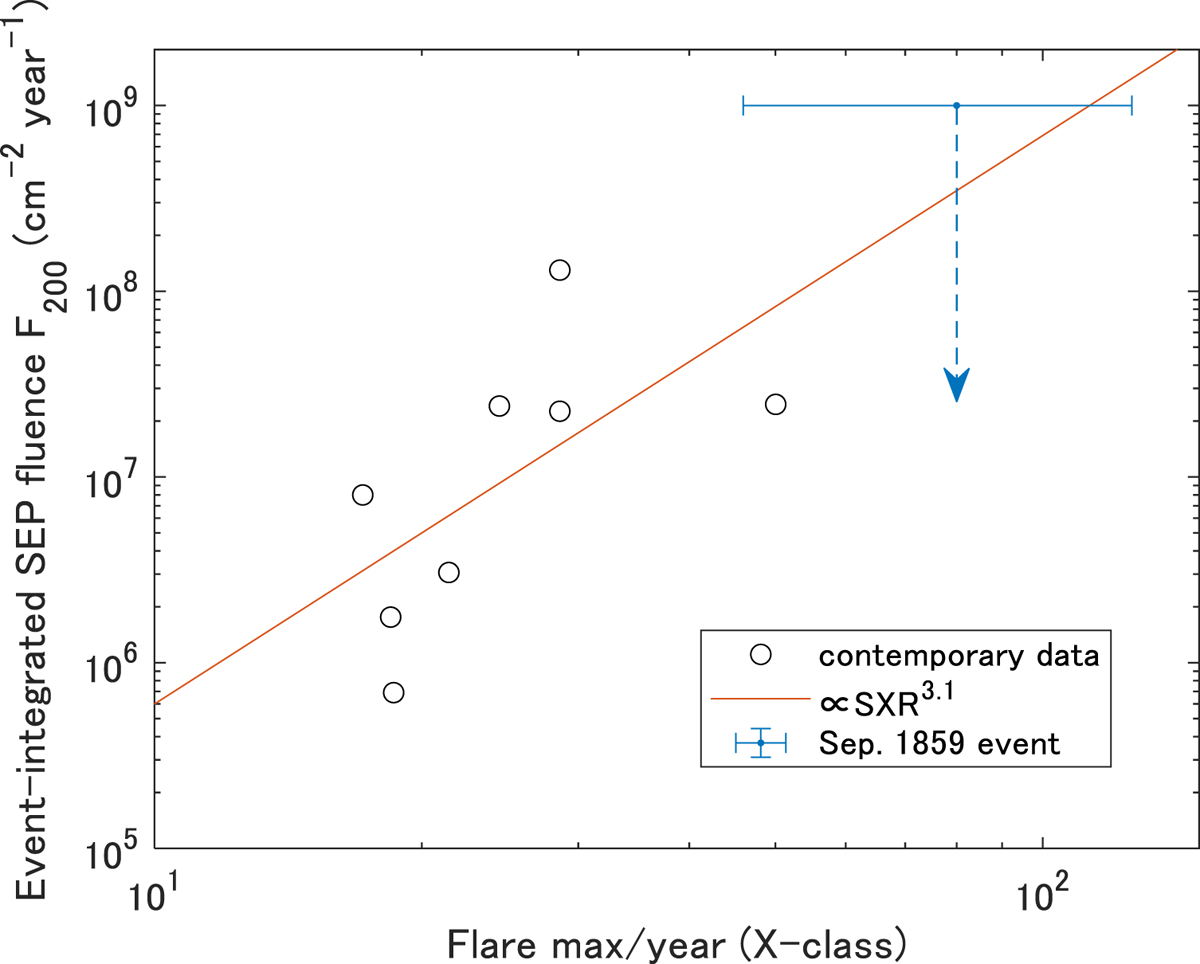
Relationship between SXR peak intensity of extreme solar flare (largest intensity within a year, >X10 in the previous category, https://www.sws.bom.gov.au/Educational/2/3/9) and integrated SEP fluence above 200 MeV (F200 [cm−2], Kovaltsov et al., 2014) for the same year of the extreme solar flare, for the period from 1976 to 2020 CE (circles). The flare scale for the period 1976–2017 CE is recalibrated (i.e., the previous SXR peak intensity × 1.43) (Cliver et al., 2022). Estimations of SXR peak intensity for the Carrington events are reported in Hayakawa et al. (2023a). The arrow indicates the upper limit of F200 for the Carrington event (see text).
Current usage metrics show cumulative count of Article Views (full-text article views including HTML views, PDF and ePub downloads, according to the available data) and Abstracts Views on Vision4Press platform.
Data correspond to usage on the plateform after 2015. The current usage metrics is available 48-96 hours after online publication and is updated daily on week days.
Initial download of the metrics may take a while.


