Figure 7
Download original image
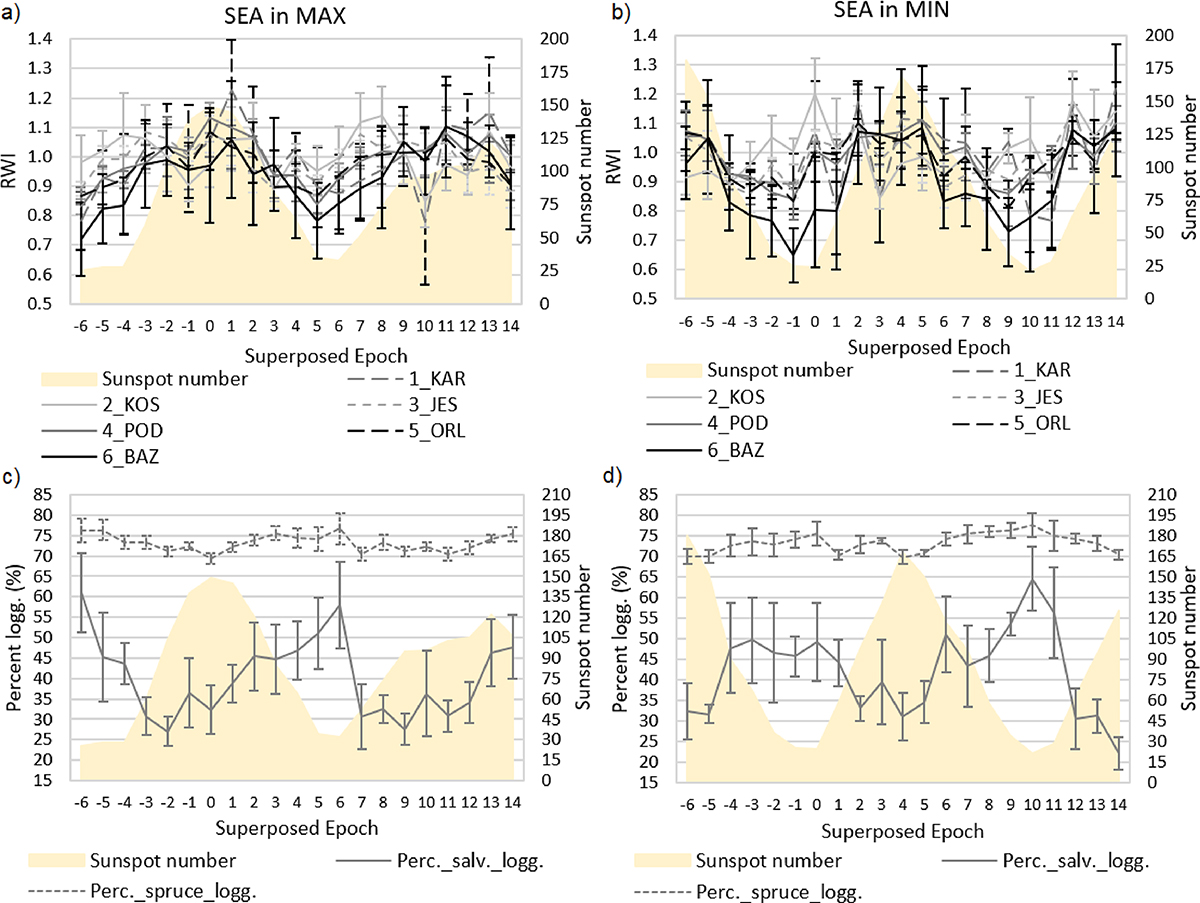
Plots of epoch-superposed subsets in 1961–2019 from solar maximum (max) and solar minimum (min) in relative −6 years before and 14 years after the key epoch; RWI research plots in max a) and in min b); percentage of spruce logging and percentage of salvage logging (logg.) in max c) and in min d); the error bars show the one-standard-deviation half-widths.
Current usage metrics show cumulative count of Article Views (full-text article views including HTML views, PDF and ePub downloads, according to the available data) and Abstracts Views on Vision4Press platform.
Data correspond to usage on the plateform after 2015. The current usage metrics is available 48-96 hours after online publication and is updated daily on week days.
Initial download of the metrics may take a while.