Open Access
Figure 10
Download original image
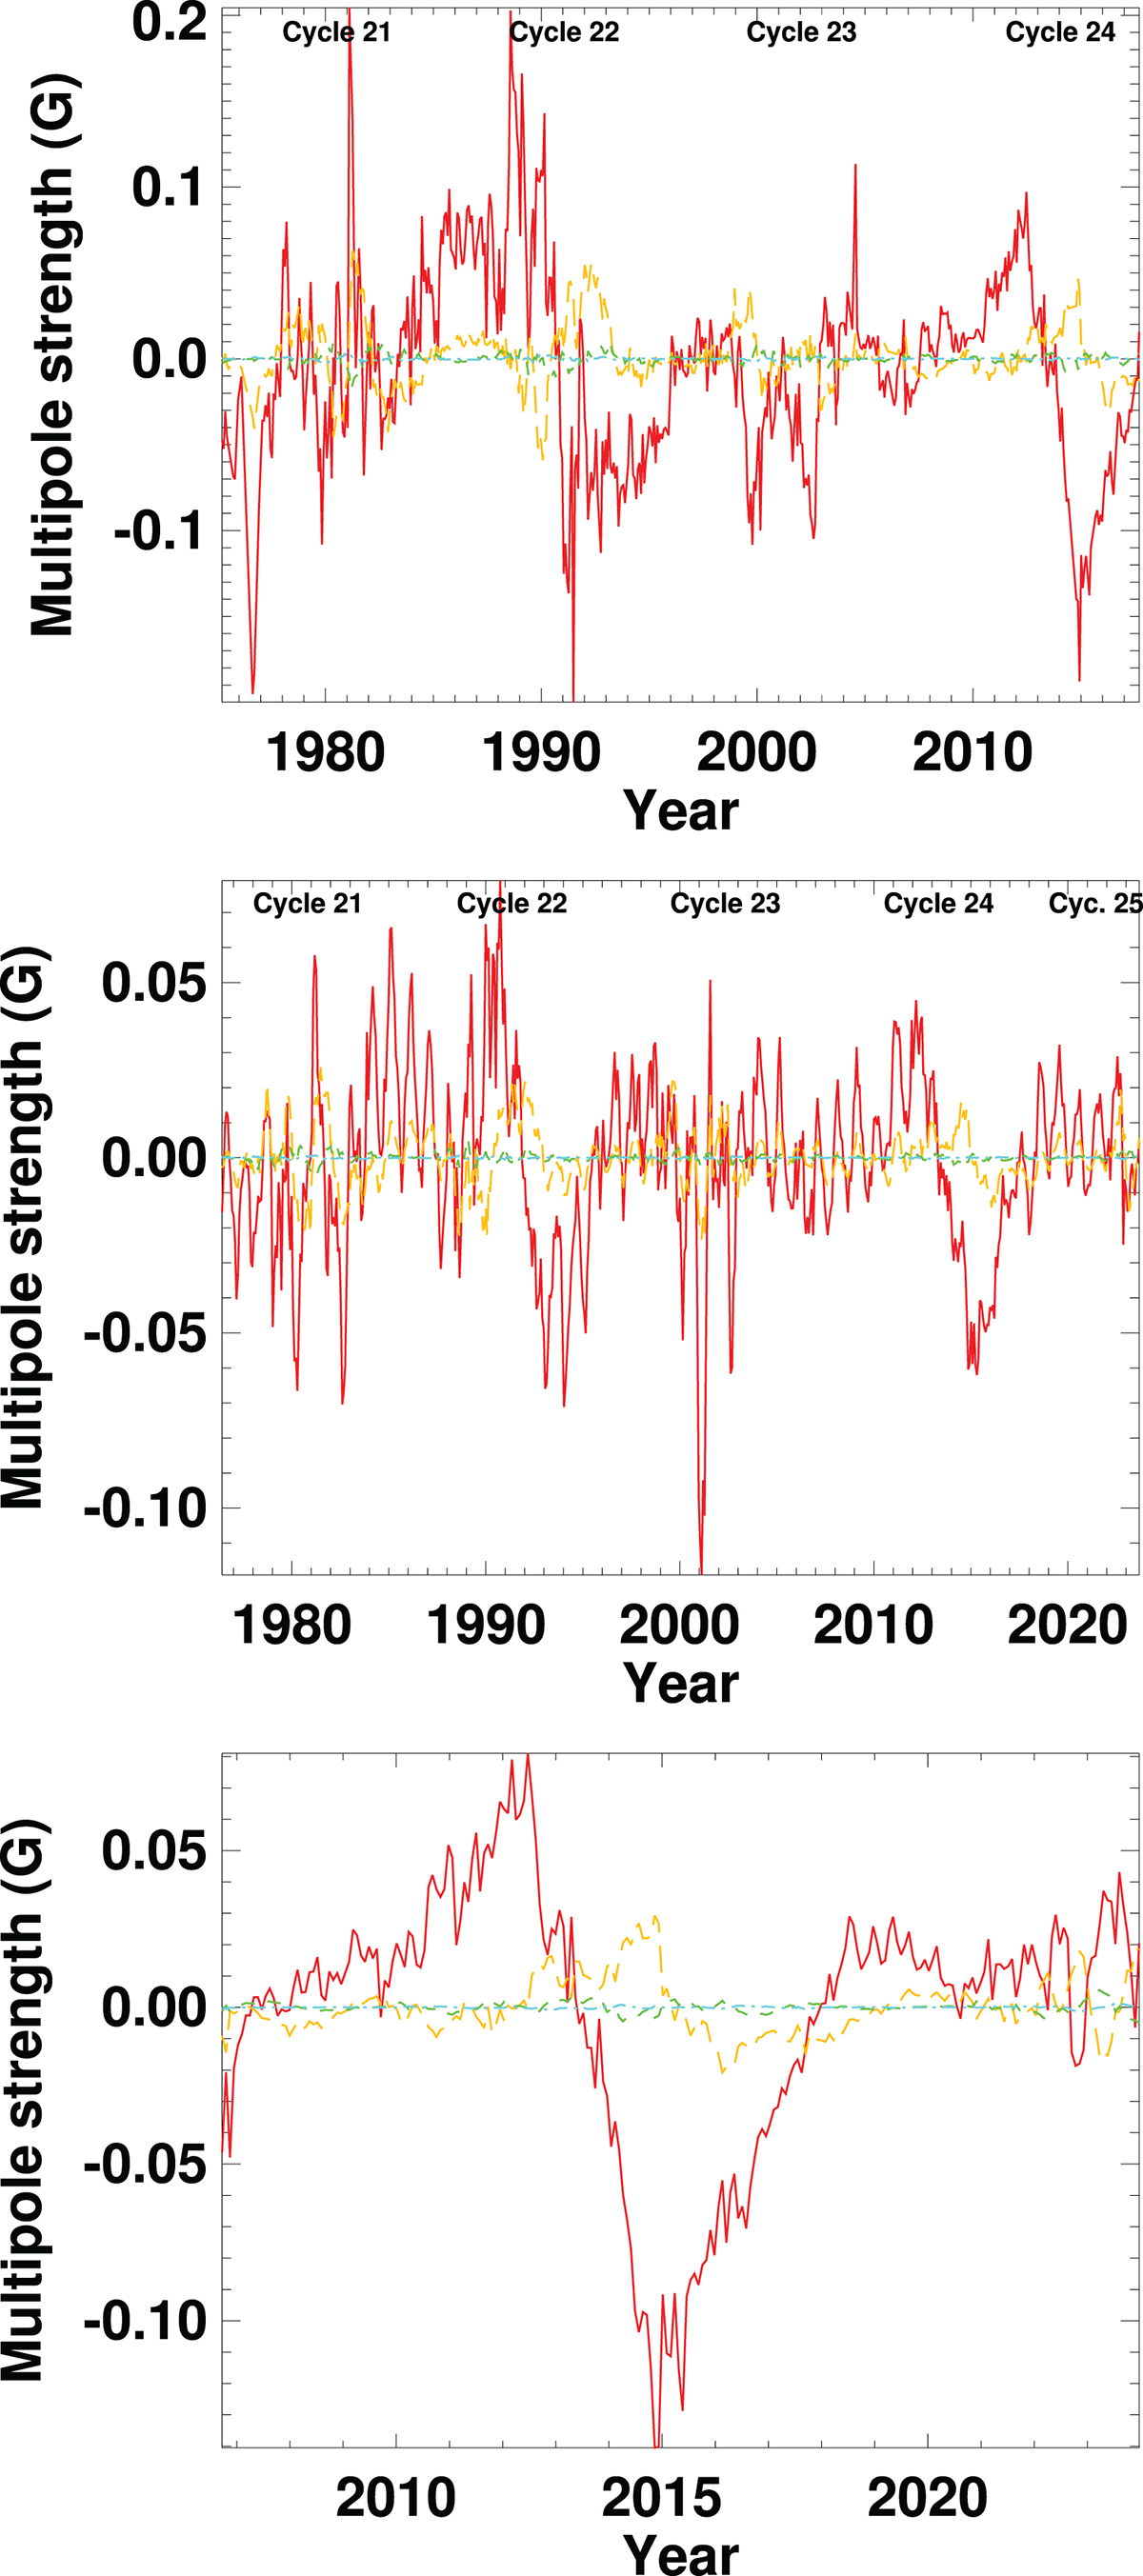
For KPVT and SOLIS (top), Wilcox (middle), and GONG (bottom) data the signed axial even multipole strengths are plotted against time. Red, amber, and green represent fields with n = 2, 4, 6, respectively.
Current usage metrics show cumulative count of Article Views (full-text article views including HTML views, PDF and ePub downloads, according to the available data) and Abstracts Views on Vision4Press platform.
Data correspond to usage on the plateform after 2015. The current usage metrics is available 48-96 hours after online publication and is updated daily on week days.
Initial download of the metrics may take a while.